
TL;DR:
- Most restaurant failures result from choosing locations based on intuition rather than data evidence. Using layered, site-specific real estate data—such as demographics, accessibility, competition, and trade areas—improves decision accuracy and reduces risk. Incorporating directionality via travel-time analysis and validating with local insights are essential for making informed, confident restaurant site selections.
Gut instinct has built some great restaurants. It has also buried a lot of them. The uncomfortable truth is that most failed restaurant openings share one common thread: the operator chose a location based on feel rather than evidence. Real estate data is now foundational to analytical site selection, and the gap between operators who use it and those who don’t is widening fast. This article breaks down exactly which data layers matter, how to apply them sequentially, and where even experienced operators get tripped up when they mistake a great-looking street for a great location.
Table of Contents
- Understanding the layers of real estate data
- From data to strategy: Step-by-step on smarter site selection
- The expert nuance: Is directionality the key most miss?
- Data is not destiny: The role of local fit and real-world validation
- A reality check for new adopters: What most guides overlook
- Find your next restaurant success with data-backed confidence
- Frequently asked questions
Key Takeaways
| Point | Details |
|---|---|
| Multiple data layers matter | Demographics, travel time, and competition must be combined for site selection clarity. |
| Modern access tools are superior | Travel-time and directionality data outperform basic radius models for assessing true opportunity. |
| Forecast, then validate | Use data for forecasting but always confirm with local knowledge and site visits. |
| Transparency wins trust | Documenting your data sources and decision process is essential for stakeholder confidence. |
Understanding the layers of real estate data
Real estate data is not a single number or a heat map you glance at once. It is a stack of distinct information types, each answering a different question about a site’s potential. Understanding each layer, and knowing how they interact, is what separates a defensible site selection decision from an expensive gamble.
The four core data types that form the backbone of restaurant site selection analytics are:
- Demographics: Who lives, works, or passes through the area? Age distribution, household income, daytime worker population, and residential density all shape demand volume and cuisine compatibility.
- Accessibility and travel time: How long does it realistically take customers to reach you? Not in miles, but in actual driving or walking minutes given traffic, road layout, and transit options.
- Competition density: How many similar concepts operate within your real trade area? What is their relative strength, tenure, and pricing position?
- Trade area definition: What is the realistic geographic zone from which you can draw 80% of your customers? This is often far smaller and less circular than operators assume.
These layers are most powerful when used in combination. Relying on any single one creates blind spots. A site may show strong demographics but suffer from terrible accessibility. Another may look uncrowded competitively but sit in a trade area that is too narrow to support volume.
“Layered evidence is far more reliable than any single metric. The most successful site selections treat each data type as a filter, not a verdict.”
One important evolution in how data is gathered is the shift from radius analysis to isochrone analysis. A radius draws a circle of a fixed distance around a location. An isochrone draws the boundary of how far someone can travel in a set amount of time, accounting for actual roads and traffic. Isochrone-based trade areas are almost always irregular shapes, and that irregularity reflects the real world. For more on how using foot traffic data fits into this framework, or to build foundational knowledge on the topic, restaurant real estate 101 is a strong starting point.
| Data type | What it answers | Common mistake |
|---|---|---|
| Demographics | Who is the customer? | Using metro-level data instead of site-level |
| Accessibility | Can customers reach you easily? | Relying on miles instead of travel time |
| Competition | How crowded is the segment? | Counting competitors too broadly or narrowly |
| Trade area | Where do customers actually come from? | Assuming a perfect circle around the address |
The data collection process itself matters. Sources range from census data and third-party mobility providers to point-of-sale aggregates and municipal permit databases. Knowing where your data comes from, how recent it is, and how it was normalized for your use case is critical for making reliable decisions. We will return to this point in the perspective section, because it is where many operators quietly fail.
From data to strategy: Step-by-step on smarter site selection
Once you understand the data layers, the next challenge is sequencing them into a decision process that actually narrows your candidate list and reduces financial risk. Most operators jump to property visits before they have done enough analytical work, which wastes time and biases decisions toward aesthetics over performance potential.
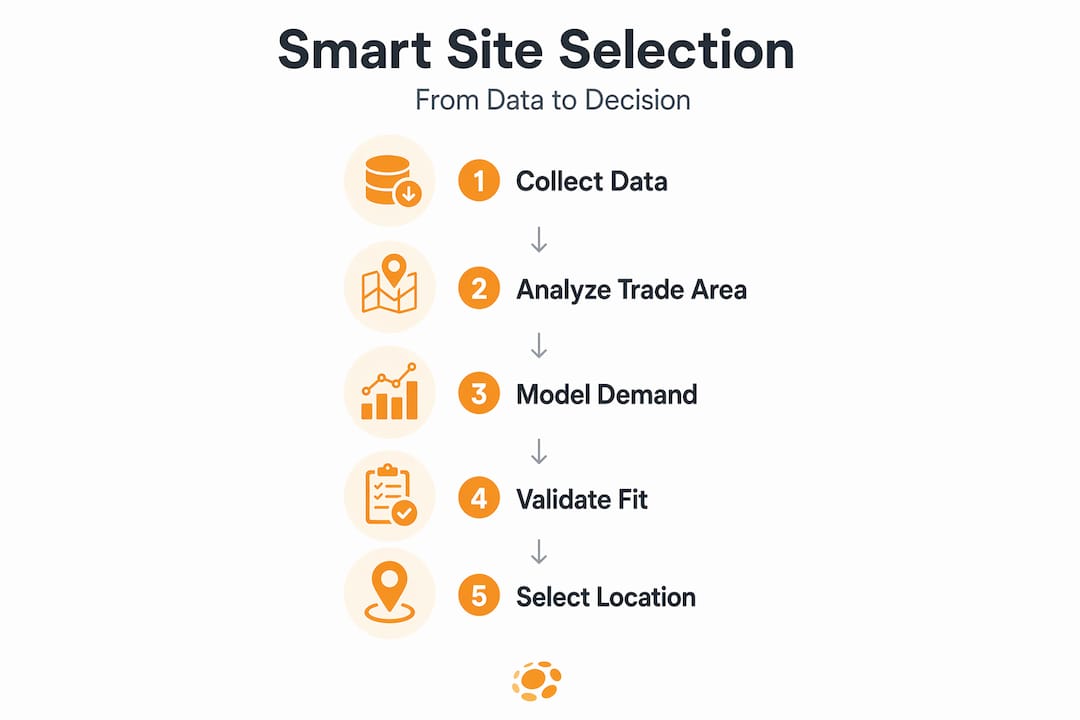
Successful operators treat data as a pipeline: define the customer and occasion model first, then map it to the trade area, quantify demand, and validate with forecasts before ever signing a letter of intent. Here is what that looks like in practice:
- Define your ideal customer and occasion. Are you capturing weekday lunch crowds from nearby office parks? Weekend family dinners from residential neighborhoods? Date-night traffic? Your customer profile determines which demographic and accessibility signals actually matter.
- Map the trade area using access-aware methods. Use travel-time isochrones, not radius circles. A five-minute drive in a dense urban grid is very different from a five-minute drive on a suburban arterial road.
- Quantify daypart demand. This step is chronically underused. Different sites perform differently by time of day. A location with massive morning foot traffic may be dead by 7 p.m. Match demand patterns to your operating model.
- Forecast revenues and risks. Build a site-level revenue model that factors in competition, potential cannibalization of existing locations, and realistic ramp-up timelines. Stress-test optimistic assumptions.
- Conduct a site visit and local fit validation. Data gets you to the short list. The visit confirms or disqualifies. We cover this in detail in the next section.
Pro Tip: When presenting your site selection rationale to partners, investors, or lenders, the methodology you used matters as much as the conclusion. A well-documented process, where inputs, sources, and decision logic are clear, builds confidence and holds up under scrutiny.
Daypart demand modeling deserves a closer look because it reveals something counterintuitive: a high-traffic location is not necessarily a high-revenue location for your specific concept. A breakfast and brunch operator will read foot traffic data very differently than a late-night bar. Layering time-specific mobility data onto your trade area analysis can reveal whether the volume you see on the street actually aligns with your operating hours.

The restaurant expansion checklist is a useful companion when working through this sequential process, and expert site selection tips offer additional operator-tested guidance on prioritizing the right signals at each stage.
The expert nuance: Is directionality the key most miss?
Here is where site selection gets genuinely interesting, and where a lot of even experienced operators leave value on the table. The concept of directionality refers to how the flow of customer movement, shaped by traffic patterns, barriers, and road geometry, creates asymmetric trade areas that simple circular radius models completely miss.
Circular radii and proximity metrics mislead whenever access is constrained by highways, rivers, rail lines, one-way street networks, or major intersections. A restaurant located just across a six-lane road from a dense residential area may effectively be invisible to those residents because crossing that road is a genuine friction point. The raw radius says those residents are within half a mile. Reality says almost none of them will show up.
| Approach | What it measures | Risk | Best for |
|---|---|---|---|
| Standard radius | Straight-line distance from site | Overestimates accessible population | Quick preliminary screening only |
| Drive-time isochrone | Realistic travel time by car | Misses pedestrian/transit behavior | Suburban and drive-to locations |
| Walk-time isochrone | Pedestrian access zones | Undervalues car-dependent areas | Urban dense markets |
| Combined isochrone | Multi-mode access layered | Requires more data | Full trade area validation |
The practical implication is significant. Two locations that look identical in a radius analysis can have dramatically different accessible population sizes once you account for directionality. The site on the “going home” side of a major commuter corridor will outperform the site on the “going to work” side for dinner service, almost every time, even if they are physically adjacent.
Pro Tip: When evaluating any site, ask your data provider or broker how the trade area model handles one-way streets, traffic barriers, and real road networks. If the answer is vague or the tool only offers radius options, you are working with an incomplete picture.
Learning to evaluate location with data that accounts for directionality is one of the most practical upgrades any operator or broker can make to their site selection toolkit. It takes the same raw information and extracts far more accurate conclusions from it.
Data is not destiny: The role of local fit and real-world validation
Even the most sophisticated data model cannot see everything. Local fit and operational constraints remain indispensable validation steps, and skipping them is a mistake that no amount of predictive scoring can save you from.
Here are the real-world factors that data consistently struggles to capture:
- Community culture and integration: A neighborhood’s personality, its loyalty to existing businesses, its openness to new concepts, and its tolerance for price points are things you absorb in person, not from a spreadsheet.
- Hyper-local competitive dynamics: The data may show three competing restaurants within your trade area. What the data may not show is that one of them has a six-year waitlist, owns the local catering market, and sponsors every neighborhood event.
- Municipal and operational quirks: Permit timelines, health department culture, parking enforcement patterns, and landlord responsiveness to tenant issues are all location-specific and largely invisible in aggregate data.
- Physical site constraints: Grease trap capacity, kitchen ventilation limitations, load-bearing issues for equipment, and outdoor patio permitting requirements are details that only a site visit and professional inspection will reveal.
- Seasonal traffic variation: Annual mobility data smooths over seasonal swings that can dramatically affect a tourist-adjacent or weather-sensitive location.
“Data clarifies, but it does not eliminate uncertainty. The best site selectors are the ones who use data to ask better questions during the site visit, not to skip it.”
This balance is worth protecting as commercial real estate data tools become more sophisticated and seemingly authoritative. The more confident a platform sounds, the more important it is to remain skeptical and validate in person. A listing like a full restaurant for sale in Inglewood, CA illustrates this well: the data context matters, but so does walking the block, talking to neighbors, and understanding the community before committing. The broader trend of data-driven real estate models is genuinely positive, but they work best when paired with operator judgment.
A reality check for new adopters: What most guides overlook
Most articles on restaurant site selection data end at the framework. They give you the steps, name the data types, and send you off with confidence. What they rarely admit is how much the quality of your outcome depends on something less glamorous: your ability to understand and communicate your methodology.
We have seen operators make solid location decisions using relatively simple data tools, and we have seen others make costly mistakes with access to expensive, sophisticated platforms. The difference almost never comes down to the sophistication of the tool. It comes down to whether the operator understood what the tool was actually measuring, where its assumptions lived, and how to translate its outputs into a defensible recommendation.
Methodology transparency is necessary to avoid over-reliance on black-box platforms. Knowing how footfall is measured, what sample sizes support the model, and how competitive density is calculated allows you to catch errors before they become lease commitments.
Three concrete traps to avoid as a new data adopter:
- Black-box over-reliance. If your platform produces a score or recommendation without explaining the inputs, treat it as a starting point, not a conclusion. Push for the underlying data and assumptions.
- Ignoring community feedback. Quantitative data and local community input are not competing signals. They are complementary. Talk to neighboring business owners, local customers, and even competitors before finalizing a decision.
- Skipping the site visit. No scoring model replaces walking the block at 7 p.m. on a Thursday. Operational reality always adds context that data cannot.
Pro Tip: Document your full site selection process in writing, capturing inputs, data sources, key assumptions, and decision rationale. This documentation becomes a powerful asset when presenting to investors, applying for financing, or defending a decision to partners later.
For operators and brokers who want to sharpen their process further, securing the ideal space with a clear analytical framework gives you a significant advantage in competitive markets where the best sites attract multiple serious candidates simultaneously.
Find your next restaurant success with data-backed confidence
Turning analytical insight into an actual location decision requires access to the right properties alongside the right data context. That is a combination most generic commercial real estate platforms simply do not offer.

Pepperlot is built specifically for restaurant operators, brokers, and landlords who need both. Every listing on the platform includes restaurant-specific details like grease trap specs, seating capacity, permit status, and patio access, the operational details that matter when you are moving from market analysis to site-specific evaluation. Whether you are searching for curated lease listings with infrastructure already in place or exploring restaurant spaces for sale in emerging markets, Pepperlot’s network of over 500 active operators, landlords, and brokers gives you direct access to serious opportunities. The platform connects your data discipline to real, actionable inventory so you can move from analysis to action with confidence.
Frequently asked questions
What are the most important real estate data points for selecting a restaurant location?
Demographics, accessibility, competition, and trade areas are the most critical inputs for restaurant site selection, and they are most powerful when used together rather than in isolation.
How does travel-time analysis outperform traditional location radii?
Travel-time isochrone boundaries account for real road networks, traffic, and directionality, giving a far more accurate picture of which customers can actually reach a site compared to straight-line distance radii.
Should brokers and operators rely solely on predictive data scoring?
No. Local fit remains indispensable, and data scoring should be treated as a filter that narrows the candidate list rather than a final verdict that eliminates the need for on-the-ground validation.
Why is methodology transparency important in real estate data analysis?
Transparent data methods allow operators and brokers to catch flawed assumptions before they lead to costly decisions, and they create defensible documentation that holds up with partners and investors.
Leave a Reply