
TL;DR:
- Restaurant success depends primarily on location, which influences customer base, revenue potential, and operating costs.
- Rigorous site analysis, including traffic patterns, demographics, and competition, is essential to avoid costly failures.
- Combining data-driven models with local intelligence ensures informed decisions for sustainable restaurant placement.
Most restaurant operators believe a great concept and a talented chef are enough to guarantee success. The hard truth is that location accounts for 60-70% of a restaurant’s success or failure, and sites chosen without rigorous analysis carry an 80% failure rate within three years. Whether you’re an operator hunting for your next space or a landlord trying to attract the right tenant, understanding the mechanics of smart site selection is the single most valuable skill you can develop. This guide breaks down exactly how to do it.
Table of Contents
- Rethinking location: Why site selection drives restaurant success
- Essential site selection criteria for operators and landlords
- Data-driven tools and predictive models: Avoiding costly mistakes
- The competition factor: Restaurant row effect vs. saturation risk
- Lease structures and landlord considerations: Securing a sustainable deal
- What most people overlook when choosing a restaurant location
- Discover prime restaurant locations and expert leasing support
- Frequently asked questions
Key Takeaways
| Point | Details |
|---|---|
| Location is critical | Choosing the right site explains most restaurant success or failure, far more than concept or food. |
| Balance competition | Locate near 3–9 competitors to benefit from clustering without risking oversaturation. |
| Use data models | Data-driven site selection, including traffic and demographic analysis, prevents expensive mistakes. |
| Lease terms matter | Favor deals where rent stays below 10% of revenue and evaluate NNN structures carefully. |
| Go beyond the numbers | Local quirks and unique risks aren’t captured in data, so always combine analytics with on-the-ground research. |
Rethinking location: Why site selection drives restaurant success
Most people treat location as a checkbox. They pick a neighborhood they like, drive by a few storefronts, and sign a lease based on gut feeling. That approach is expensive. The reality is that poor location choices produce failure rates exceeding 80% within three years, regardless of how good the food is or how strong the brand identity may be.
Location shapes everything downstream. It determines your customer base before you open your doors. It sets your revenue ceiling before you hire a single server. It influences your marketing costs, your staffing needs, and your ability to survive a slow quarter. Treating it as anything less than a strategic decision is a mistake that costs operators hundreds of thousands of dollars.
“A restaurant’s address is its most permanent business decision. You can change the menu, the chef, and the decor. You cannot change the street.”
Here is what a rigorous site selection process actually examines:
- Visibility and signage potential: Can passing traffic see your entrance clearly from both directions?
- Anchor proximity: Are you near a grocery store, gym, or cinema that generates consistent foot traffic?
- Daytime vs. nighttime population: A lunch-focused concept needs office density; a dinner concept needs residential density.
- Transit access: Proximity to bus stops and subway stations dramatically affects walk-in volume.
- Historical site performance: Has the space had multiple failed tenants? That pattern rarely reverses itself.
Understanding which restaurant space types fit your concept is the first filter before you ever visit a property. A ghost kitchen has entirely different site requirements than a full-service neighborhood bistro, and conflating the two wastes everyone’s time.
Essential site selection criteria for operators and landlords
With the justification for rigorous location selection established, the next step is pinning down the exact criteria used by the best operators and landlords. These are not opinions. They are measurable benchmarks that separate profitable sites from money pits.
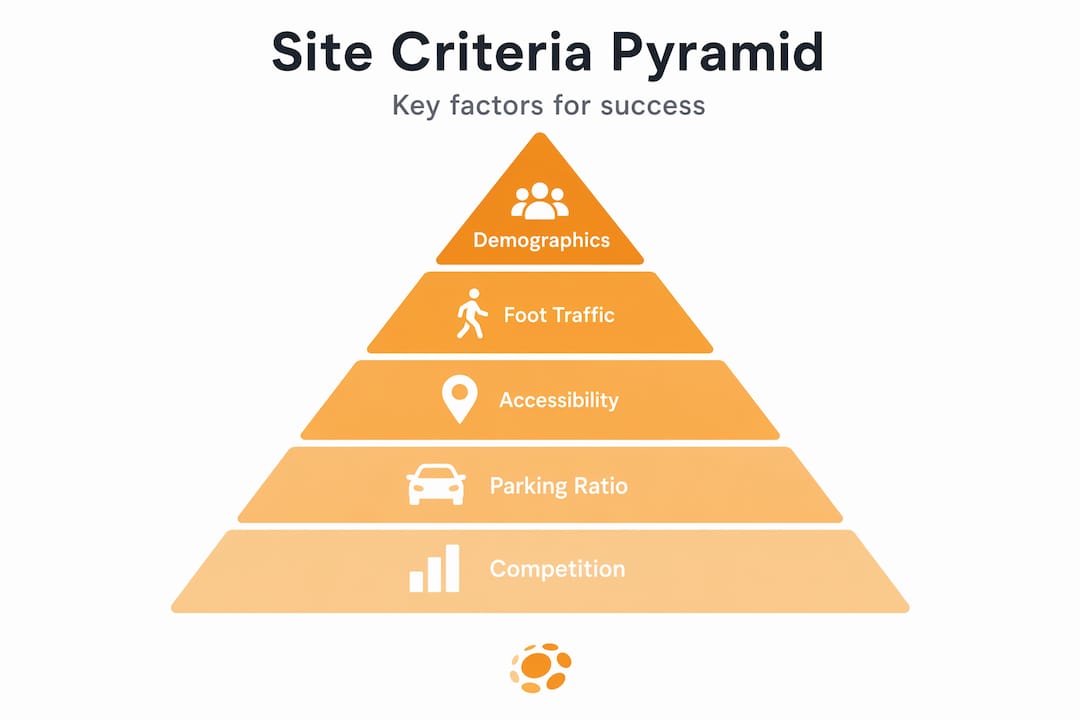
Critical criteria include target audience demographics, foot traffic analysis by daypart, accessibility and parking ratios, competition saturation, and lease costs relative to projected revenue. Each of these deserves serious attention before any negotiation begins.
| Criterion | Benchmark | Why it matters |
|---|---|---|
| Median household income | $80k+ for fine dining; $45-65k for casual | Determines spending capacity of local audience |
| Population density | 10,000+ per sq mile for urban casual | Drives walk-in volume without heavy marketing |
| Parking ratio | 1 space per 150-200 sq ft for casual dining | Directly impacts suburban dinner covers |
| Competitor count | 3-9 within 0.5 miles | Validates demand without oversaturation |
| Rent as % of revenue | 6-10% of projected revenue | Protects operating margins long-term |
| Average daily traffic (ADT) | 15,000+ vehicles for QSR drive-thru | Ensures visibility for impulse visits |
Pro Tip: Visit your target site at least four different times: weekday lunch, weekday dinner, weekend lunch, and weekend dinner. Foot traffic patterns shift dramatically between these windows, and foot traffic evaluation done at only one time of day gives you a dangerously incomplete picture.
A few additional criteria that operators frequently underestimate:
- Zoning compliance: Not every commercially zoned property allows food service. Restaurant zoning rules vary significantly by municipality and can block you from installing a hood system or operating late-night hours even after you’ve signed a lease.
- Grease trap availability: Retrofitting a grease trap into a space that doesn’t have one can cost $15,000 to $50,000 and delay your opening by months.
- Ceiling height: Open kitchens and certain ventilation systems require minimum ceiling clearances that many older retail spaces simply cannot accommodate.
- Loading dock access: High-volume operations receiving daily produce and beverage deliveries need rear access that doesn’t disrupt the dining room.
Landlords benefit from understanding these criteria just as much as operators do. A landlord who can demonstrate that their property meets these benchmarks will attract better tenants faster and negotiate from a position of strength.
Data-driven tools and predictive models: Avoiding costly mistakes
Armed with these baseline criteria, the next step is leveraging advanced analytics to make even smarter, more resilient choices. The restaurant industry has lagged behind retail in adopting predictive site modeling, but that gap is closing fast.

Key methodologies for restaurant site selection now include data-driven site scoring models that incorporate customer demographics, traffic patterns, competition density, co-tenant quality, and financial viability assessments including cannibalization analysis. Cannibalization analysis measures how much a new location will pull revenue away from your existing locations, a critical calculation for any operator with more than one unit.
Here is how a modern site scoring model works in practice:
- Define your customer profile. Use data from your existing locations to build a detailed picture of who actually visits you: age, income, distance traveled, visit frequency, and daypart preference.
- Map trade area potential. Apply your customer profile to the new site’s surrounding population to estimate the addressable customer base within a 1, 3, and 5-mile radius.
- Score the site against benchmarks. Run each criterion through a weighted scoring system where high-impact factors like traffic volume and income match carry more weight than secondary factors.
- Backtest the model. Validate your model against sites you already operate to confirm it accurately predicts performance. Models that haven’t been backtested against real outcomes are guesses wearing a spreadsheet costume.
- Stress-test the revenue forecast. Run scenarios at 70%, 85%, and 100% of projected volume to confirm the lease remains sustainable even in a slower-than-expected ramp-up period.
Pro Tip: A bad lease decision based on incomplete data can cost you more than $100,000 in losses before you even realize the site was wrong. Investing $2,000 to $5,000 in a professional site analysis is one of the highest-return expenditures in restaurant real estate. Review expert real estate tips to understand what professional site reviews typically cover.
| Model input | Data source | Impact on score |
|---|---|---|
| Daytime population | Census + mobile data | High |
| Competitor proximity | Mapping APIs | Medium-High |
| Co-tenant quality | Broker data | Medium |
| Historical site performance | Public records | High |
| Cannibalization risk | Internal sales data | High |
The competition factor: Restaurant row effect vs. saturation risk
Beyond data, competitive context is a powerful and often misunderstood factor in site success. Many operators instinctively avoid areas with lots of restaurants. That instinct is sometimes right, but often wrong.
Research on clustering shows that 3-9 nearby competitors produce fewer closures than either extreme. This is the “restaurant row effect,” where a concentration of dining options creates a destination that draws more total diners than any single restaurant could attract alone. Think of it as the food court principle applied to city blocks.
The mechanism is called agglomeration. When multiple restaurants cluster together, they collectively generate more foot traffic than they would in isolation. Diners who are unsure where to eat gravitate toward areas where they know options exist. The cluster reduces decision friction and increases the likelihood that any given person walking by will stop and eat somewhere.
“Clusters of 3-9 restaurants create destination dining zones. Clusters of 10 or more create a race to the bottom on price and margins.”
However, the data is equally clear about the risks at both extremes. Oversaturation and undersaturation each drive significant closure rates, with oversaturation (too many competitors) contributing to 32% of closures and undersaturation (too little demand) contributing to 38%. Both failure modes are preventable with proper market mapping.
Here is how to apply this practically:
- Map your competitive set within a 0.5-mile radius. Count direct competitors (same cuisine or price point) separately from indirect competitors (different cuisine but same occasion).
- Assess differentiation potential. If the cluster already has three Italian restaurants, a fourth is unlikely to thrive unless it offers a meaningfully different format or price point.
- Look for underserved dayparts. A cluster of dinner-focused restaurants may have zero strong lunch options, creating a profitable niche even in a competitive zone.
- Track competitor health. A cluster with several struggling restaurants signals oversaturation. A cluster with long waits and strong reviews signals healthy demand.
Use an expansion location checklist to systematically evaluate competitive dynamics before committing to any site. If you are working through expansion challenges for the first time, competitive mapping is the step most operators skip and most regret skipping.
Lease structures and landlord considerations: Securing a sustainable deal
Having covered external and competitive influences, let’s turn to the specifics of lease structure and landlord-tenant relationships. The lease is where all your site selection work either pays off or gets erased by unfavorable terms.
NNN leases (triple net leases) are the dominant structure in restaurant real estate, particularly for QSR and fast-casual tenants. In a NNN lease, the tenant pays base rent plus property taxes, insurance, and maintenance costs. For landlords, this creates predictable, near-passive income. For operators, it means your true occupancy cost is higher than the base rent figure suggests, which is why the 6-10% of revenue benchmark must be applied to your total occupancy cost, not just base rent.
Here is what landlords should do to attract and screen quality restaurant tenants:
- Document your property’s restaurant-ready infrastructure. List grease trap capacity, hood system specifications, electrical capacity (in amps), gas line size, and ventilation access. Operators will ask, and having answers ready signals professionalism.
- Understand your ideal tenant profile. A 1,200-square-foot endcap with 15,000+ average daily traffic is ideal for a QSR franchise. A 4,000-square-foot space with a patio suits a full-service casual concept. Match the space to the right operator category.
- Offer co-tenancy transparency. Disclose who your anchor tenants are and their lease expiration dates. Operators make location decisions partly based on neighboring businesses.
- Structure lease escalations reasonably. Annual rent increases of 2-3% are standard and acceptable. Escalations above 4% annually create cash flow stress that leads to tenant defaults.
- Consider a build-out allowance. Offering tenant improvement dollars attracts better operators who would otherwise choose a more turnkey space.
Pro Tip: Review lease terms explained before entering any negotiation, and make sure you understand essential lease clauses that protect both parties. Clauses covering exclusivity, permitted use, assignment rights, and co-tenancy conditions are the four most commonly negotiated and most commonly misunderstood.
What most people overlook when choosing a restaurant location
Data models are powerful. They reduce guesswork and force discipline into decisions that are often driven by emotion. But they have blind spots, and those blind spots have closed restaurants that looked perfect on paper.
Heritage buildings restrict modifications in ways that no demographic model captures. A beautiful historic storefront in a high-income neighborhood may prohibit you from cutting a new ventilation shaft, which means you cannot install the hood system your kitchen requires. The model says “excellent site.” The building inspector says “no kitchen.” The model wins on paper. The building wins in reality.
Public venue locations like train stations, airports, and stadiums carry external risk that no amount of traffic data can fully predict. A labor strike, a venue closure, or a major event cancellation can eliminate 40% of your revenue overnight. These locations can be highly profitable, but they require a risk buffer that purely statistical models don’t account for.
Gentrification is another factor that cuts both ways. Operators who move into an up-and-coming neighborhood early can capture below-market rents and build a loyal customer base before the area matures. But clustering in a gentrifying area accelerates rent inflation, and operators who signed short leases often find themselves priced out of the neighborhood they helped create.
The operators and landlords who consistently make the best location decisions combine rigorous analytics with what we call “boots-on-the-ground intelligence.” That means talking to neighboring business owners, attending local planning meetings, reading neighborhood association minutes, and spending real time in the area at different times of day and week. Expert location tips consistently emphasize this layered approach because the data tells you what is happening. Local knowledge tells you why, and why is what predicts what happens next.
Discover prime restaurant locations and expert leasing support
When you’re ready to apply these lessons, it helps to have specialists guiding your search. Pepperlot is built specifically for restaurant real estate, which means every listing includes the details that actually matter to operators and landlords: grease trap specs, seating capacity, permit status, patio access, and kitchen infrastructure.
Whether you’re an operator looking for a restaurant for sale in Inglewood, searching for a turnkey restaurant on La Cienega, or a landlord trying to connect with vetted, serious tenants, Pepperlot’s network of over 500 active operators, landlords, and brokers gives you direct access to the right people. Stop filtering through generic commercial listings that leave out everything you actually need to know. Find restaurant listings built for the way the industry actually works.
Frequently asked questions
What is the most important factor when choosing a restaurant location?
Location quality, including local demographics and visibility, determines 60-70% of a restaurant’s success, making it the single most critical decision an operator makes.
How much should I spend on rent for a new restaurant?
Lease costs should stay between 6% and 10% of projected revenue, applied to total occupancy cost including taxes, insurance, and maintenance, not just base rent.
How many competitors should be near my new location?
Aim for a zone with 3 to 9 nearby competitors for the optimal balance between validated demand and manageable competition.
What is a NNN lease, and how does it benefit landlords?
A NNN lease means the tenant covers property taxes, insurance, and maintenance, giving landlords more predictable income with significantly reduced management overhead.
What risks are often overlooked in restaurant site selection?
Heritage building restrictions, external disruptions at public venues, and rapid neighborhood gentrification can all undermine sites that score well on standard data models.
Leave a Reply