
TL;DR:
- The type of restaurant space significantly impacts buildout costs, timeline, and operational feasibility.
- Proper space allocation based on concept and menu is crucial for operational efficiency and cost management.
- Understanding space definitions, benchmarks, and detailed infrastructure is essential for selecting the right venue.
Most operators assume that finding a restaurant space is simply a matter of square footage and rent price. That assumption is expensive. The type of space you sign a lease for determines your buildout timeline, your startup costs, your operational layout, and ultimately whether your concept can even function as designed. A ghost kitchen operator who takes on a raw shell space faces a completely different financial reality than one who inherits a second-generation kitchen. Landlords who misunderstand these distinctions lose qualified tenants. Brokers who gloss over them slow deals down. This guide cuts through the confusion with clear definitions, real benchmarks, and practical planning tools.
Table of Contents
- Key restaurant space types defined
- Space allocation: Benchmarks and ratios
- Sizing by seat and kitchen: Practical guidelines
- Buildout costs and rent benchmarks
- Space definitions: What most guides miss
- Find the right restaurant space for your concept
- Frequently asked questions
Key Takeaways
| Point | Details |
|---|---|
| Space type matters | Understanding raw, second-generation, and ghost kitchen spaces drives both operational success and cost efficiency. |
| Apply occupancy benchmarks | Use established seat and kitchen ratios to shape layout decisions and maximize revenue. |
| Cost and compliance go hand-in-hand | Factor in buildout costs, required inspections, and code compliance when choosing a restaurant space. |
| Plan from menu, not ratios | Start space planning with your menu complexity and peak service demands, not just industry averages. |
Key restaurant space types defined
Not all restaurant real estate is created equal, and the terminology used to describe it carries real operational and financial weight. Before you sign anything or submit an offer, you need to know exactly what category of space you are dealing with.
Condition-based space types describe the physical state of the property:
- Raw shell (also called “vanilla box” or “cold dark shell”): A completely unfinished space with no restaurant infrastructure. No hood systems, no grease traps, no gas lines, no floor drains. You are starting from scratch, which means maximum flexibility but also maximum cost and time.
- Second-generation restaurant space: A property previously used as a restaurant, already equipped with existing infrastructure like hood systems, grease traps, gas lines, floor drains, and commercial plumbing. This significantly reduces buildout costs and timeline compared to a raw space, but it comes with its own complications.
- Turnkey space: Fully equipped and often ready to operate with minimal changes. These are rare and typically command premium rents.
- Ghost kitchen space: A commercial kitchen facility with no public-facing dining area, designed for delivery-only or virtual restaurant concepts.
Understanding second-generation spaces is particularly critical right now because so much post-pandemic inventory falls into this category, and the condition of existing infrastructure varies wildly from one property to the next.
Operational types define the service model the space is built for:
- Quick-service restaurant (QSR): High throughput, minimal table service, compact kitchen, emphasis on speed.
- Fast casual: Counter service with higher food quality than QSR, slightly more dining area per square foot.
- Casual dining: Full table service, larger kitchens, bar areas, and more seating per location.
- Fine dining: Larger per-seat footprint, elaborate kitchen setups, private dining rooms.
- Ghost kitchen: No dining room whatsoever, pure production facility.
Location-based types also define the nature of a space’s commercial context. Restaurant space categories by location include street-front (high visibility and walk-in traffic), strip centers (anchored by a grocery or big-box tenant driving consistent foot traffic), malls and food courts (best suited for QSR and fast casual formats), and mixed-use developments (urban, premium, often higher rent but vibrant foot traffic). Each location type has direct implications for your sales projections, lease terms, and required buildout.
| Space type | Setup required | Key advantage | Key challenge |
|---|---|---|---|
| Raw shell | Full buildout | Maximum design flexibility | Highest cost and longest timeline |
| Second-generation | Partial retrofit | Existing infrastructure saves time and money | May not match new concept’s layout needs |
| Turnkey | Minimal to none | Fastest to open | Limited design control, premium rent |
| Ghost kitchen | Minimal | Low overhead, delivery-focused | No brand presence, dependent on delivery platforms |
For operators exploring restaurant real estate basics, knowing these distinctions before you walk into a negotiation protects your budget and your timeline.
Space allocation: Benchmarks and ratios
Having defined space types, it’s vital to understand how space is actually allocated and measured within restaurant operations. This is where many operators make costly errors, designing a space that looks great on paper but kills efficiency in practice.
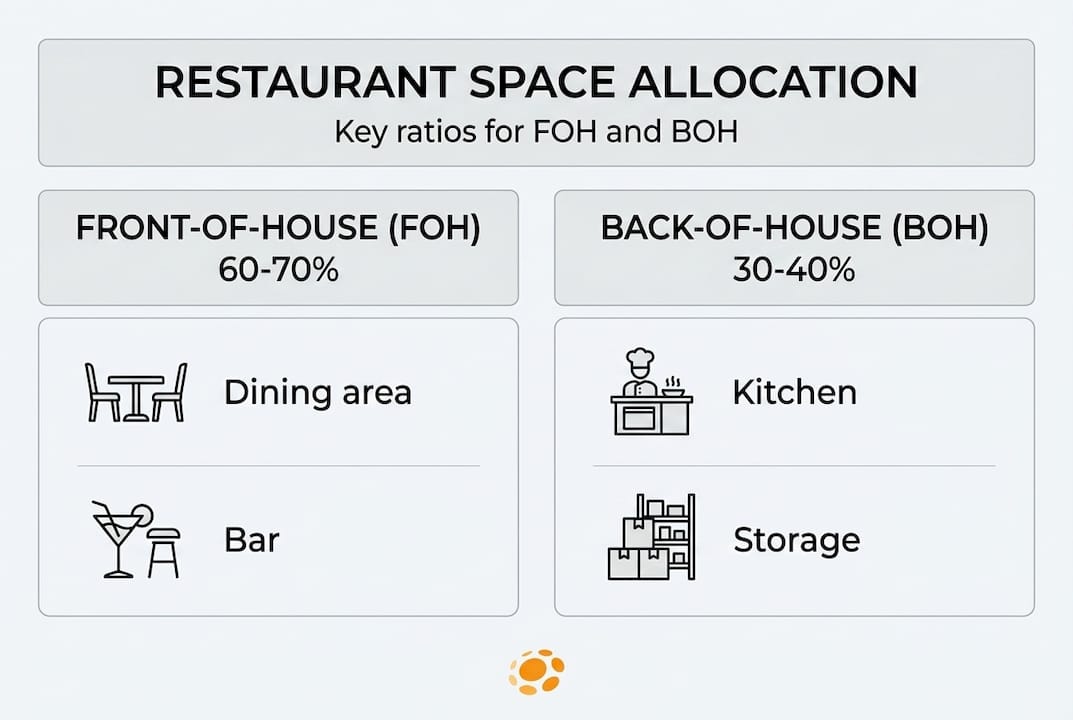
The foundation of restaurant space planning is the front-of-house (FOH) versus back-of-house (BOH) split. FOH includes your dining room, bar, waiting area, and host stand. BOH covers the kitchen, prep areas, storage, restrooms, and employee areas.
The 60/40 rule is the most widely cited standard: approximately 60% of total square footage goes to front-of-house and 40% to back-of-house. But this benchmark flexes considerably based on concept:
| Concept type | FOH % | BOH % | Dining-to-kitchen ratio |
|---|---|---|---|
| Fine dining | 67% | 33% | 2:1 |
| Casual dining | 60% | 40% | 3:2 |
| Fast casual | 65% | 35% | Varies |
| QSR | 75% | 25% | 4:1 |
| Ghost kitchen | 0% | 100% | N/A |
As a general planning benchmark, quick-service concepts prioritize more dining space for throughput while fine dining invests in larger, more elaborate kitchens to support complex menus. Ghost kitchens eliminate the front-of-house entirely, redirecting every square foot to production.
Here is how to apply these ratios to your planning process:
- Start with your revenue model. How many covers per shift do you need to hit your sales targets? That number drives your seat count, which drives your FOH square footage.
- Work backward to the kitchen. Once you know your FOH size, calculate your BOH requirements based on menu complexity and prep volume.
- Audit your storage needs. High-volume concepts need significantly more dry storage and walk-in cooler space, which eats into your BOH allocation.
- Account for compliance space. Restrooms, accessibility paths, and employee areas are non-negotiable and often underestimated in early planning.
- Revisit the layout against your service flow. A poorly positioned pass-through or expediting station can create bottlenecks that no ratio calculation will catch.
Pro Tip: Space planning starts with your menu, not your square footage. Before you measure anything, map out every dish on your menu and the equipment required to produce it. That list determines your minimum kitchen footprint, and everything else gets built around it.
The hidden costs of buildout frequently trace back to poor space allocation decisions made before construction begins. Use the expansion location checklist when evaluating any new site to catch misalignments early.

Sizing by seat and kitchen: Practical guidelines
Now that ratios are understood, it is time to translate them into actual square footage numbers for real-world planning. These benchmarks should drive every site evaluation you do, whether you are an operator, a landlord sizing a space for a tenant, or a broker assessing fit.
Space per seat by concept type:
- Full-service restaurants: 12 to 15 sq ft per seat
- Fine dining: 18 to 20 sq ft per seat
- Fast casual: 11 to 14 sq ft per seat
- QSR: 10 to 12 sq ft per seat (often lower due to high turnover and minimal table dwelling)
Kitchen space guideline: Plan for approximately 5 sq ft per seat as your baseline. A 100-seat full-service restaurant therefore needs roughly 500 sq ft of kitchen space at minimum, and more for complex menus.
Let’s put those numbers into practice. Say you are evaluating a 3,000 sq ft second-generation space for a casual dining concept.
- Using the 60/40 split: 1,800 sq ft FOH, 1,200 sq ft BOH
- At 13 sq ft per seat (mid-range for full-service), your FOH accommodates roughly 138 seats
- At 5 sq ft per seat, your kitchen should be 690 sq ft, which fits comfortably within the 1,200 sq ft BOH allocation, leaving room for storage and restrooms
This kind of backward calculation takes about 10 minutes and tells you whether a space is fundamentally viable for your concept before you invest in an architect or attorney.
Pro Tip: Always pressure-test your seat count against peak capacity, not average occupancy. If your dining room technically fits 100 seats but your kitchen can only realistically fire 60 covers simultaneously, you have a staffing and experience problem waiting to happen.
The decision to lease versus buy also connects directly to your space sizing strategy. Understanding the benefits of buying restaurant space matters more when your concept requires significant structural customization that a landlord would never approve in a standard lease. Online menus also influence space sizing in the delivery era, as operators increasingly split their seating capacity projections between in-person dining and kitchen output for third-party orders.
What landlords need to know: These benchmarks are not just for operators. When a landlord lists a 2,500 sq ft space without noting that the existing kitchen footprint is only 300 sq ft, they are setting up a mismatch. Operators will walk, or worse, they will sign and then abandon ship 18 months later when the economics fall apart.
Buildout costs and rent benchmarks
To make informed business decisions, you must factor in cost and risk variables tied to the space definitions and allocations you have just learned. This is where the financial reality of space type hits hardest.
Buildout cost comparison:
| Space type | Buildout cost per sq ft | Notes |
|---|---|---|
| Raw shell | $250 to $400 | Full MEP, hood, plumbing from scratch |
| Second-generation | $100 to $200 | Retrofit existing infrastructure |
| Turnkey | $0 to $50 | Mostly cosmetic and equipment updates |
| Ghost kitchen (raw) | $150 to $250 | No FOH but heavy kitchen investment |
According to revenue per square foot benchmarks, rent in major metro markets typically runs $50 to $90 per sq ft annually, with premium street-front locations in dense urban cores pushing even higher. In secondary markets, that range drops to $25 to $50 per sq ft.
For a 2,000 sq ft space in a metro market at $70/sq ft, you are looking at $140,000 per year in base rent, or about $11,667 per month before triple-net charges (taxes, insurance, maintenance). That context makes the buildout cost difference between a raw shell and a second-generation space staggeringly significant.
A raw shell buildout for a 2,000 sq ft space at $325/sq ft costs $650,000. The same space as a second-generation at $150/sq ft costs $300,000. That $350,000 difference is the margin between a restaurant that opens with working capital and one that is already underwater before it serves a single dish.
Here is an actionable checklist for buyers and landlords evaluating a second-generation space:
- Commission a full mechanical, electrical, and plumbing (MEP) inspection before signing.
- Verify that the hood system is sized to your planned cooking equipment and meets current code.
- Check the grease trap capacity and confirm it matches your projected volume.
- Review the previous tenant’s certificate of occupancy and any outstanding violations.
- Confirm the gas line capacity, especially if your concept is heavier on cooking than the prior tenant’s.
- Identify any asbestos or environmental concerns, particularly in older buildings.
Second-generation spaces are not automatically a bargain. They carry the fingerprints of the previous operator, including any code violations, deferred maintenance, or equipment sized for a concept that bears no resemblance to yours. Do the inspection first, negotiate the rent with full knowledge of actual retrofit costs, and budget a 20% contingency on top of your contractor estimates.
Space definitions: What most guides miss
Most guides on restaurant space types treat the definitions as static categories, as if a second-generation space is always a smart choice or a raw shell is always a gamble. Real experience tells a very different story.
The truth is that the value of any space type depends entirely on how well it matches your specific concept, your menu, and your operational model. A second-generation space built for a 90-seat Italian casual dining restaurant is practically worthless to a ghost kitchen operator who needs industrial ventilation and none of the dining room buildout. Similarly, a beautifully built raw shell in a food court may be ideal for a QSR but catastrophic for a fine dining operator who needs a different kind of neighbor and a completely different foot traffic profile.
What industry veterans actually do differently is start every site evaluation with the business plan and menu in hand, not the floor plan. They measure the existing kitchen hood against their equipment list before they measure the dining room. They ask what the prior tenant cooked and how busy they were, because that history affects the grease trap condition and the electrical load.
Specialized real estate platforms that understand these nuances make a real difference because they surface the operational details that generic commercial real estate listings omit entirely. Knowing a space has a 10-foot Type I hood and a 1,500-gallon grease trap before you schedule a showing saves weeks of discovery.
Find the right restaurant space for your concept
Understanding space types is only the first step. Acting on that knowledge requires access to listings that are specific, detailed, and restaurant-relevant.
Pepperlot is built specifically for this. Every listing on the platform includes the restaurant-specific infrastructure details that matter: hood systems, grease traps, seating capacity, permits, and patio access. You can browse a full restaurant for lease with all buildout details included, or search for a ghost kitchen for lease without sifting through irrelevant commercial listings. The platform’s location intelligence tools let you analyze foot traffic, demographics, and local competition before you commit to a site. If you are serious about finding the right space, start where the data lives.
Frequently asked questions
What is a second-generation restaurant space?
A second-generation restaurant space is a commercial property previously used as a restaurant, with existing infrastructure like hoods, grease traps, and plumbing already in place, which lowers buildout costs and saves significant time compared to a raw shell.
How do you calculate space per seat for different restaurant types?
Full-service restaurants need 12 to 15 sq ft per seat, fine dining requires 18 to 20 sq ft, fast casual runs 11 to 14 sq ft, and kitchens typically need about 5 sq ft per seat as a baseline planning figure.
What is the industry standard for front-of-house versus back-of-house space allocation?
The 60/40 rule is the standard benchmark, with 60% allocated to front-of-house and 40% to back-of-house, though fine dining shifts toward more kitchen space and QSR shifts toward more dining space.
What are typical buildout costs for restaurant spaces?
Second-generation buildout costs range from $100 to $200 per sq ft, while raw shell spaces typically run $250 to $400 per sq ft depending on market, condition, and concept complexity.
Recommended
- Restaurant Real Estate 101: How to Find, Lease, or Buy the Right Space for Your Concept | PepperLot Blog
- The Hidden Costs of Building Out a Restaurant Space (and How to Avoid Them | PepperLot Blog
- Restaurant sale vs. lease: 4 key differences for success
- Restaurant Lease Terms Explained: Secure Your Ideal Space
Leave a Reply