Tag: market data

  • How Much Does It Cost to Open a Restaurant?

    Opening a restaurant is one of the most capital-intensive small-business launches an operator can take on. The final number depends on concept, market, build-out condition, and whether you are converting raw space or taking over a second-generation restaurant. Most first-time operators underestimate soft costs, permit delays, and the working capital needed before the dining room generates stable cash flow.

    ## The major cost buckets

    **Lease and site control.** Expect first month rent, security deposit, and often several months of rent held as additional deposit or prepaid rent. Restaurant leases frequently require personal guarantees, which affects how much cash you need at signing.

    **Build-out and tenant improvements.** A ground-up conversion can run from $150 to $400+ per square foot depending on hood installation, grease trap work, walk-in coolers, electrical upgrades, plumbing, and dining room finishes. Second-generation or turnkey spaces can cut this dramatically because hood systems, grease traps, and utility capacity may already exist.

    **Kitchen equipment and FF&E.** Even in a second-generation space, you may replace or add line equipment, POS, smallwares, tables, and chairs. Budget separately for installation, hood cleaning contracts, and startup inventory.

    **Permits and professional fees.** Health permits, business licenses, alcohol licensing, architectural review, legal review of the lease, and contractor permits all carry cost and timeline risk. In many markets, liquor license transfer or new issuance is the longest pole in the tent.

    **Pre-opening labor and marketing.** Training, menu development, soft openings, and launch marketing often land in the 60 to 90 days before opening. These costs hit before revenue exists.

    **Working capital.** Plan for at least three to six months of operating reserves after opening. Payroll, food cost, utilities, and marketing do not wait for the concept to find its footing.

    ## How concept type changes the budget

    Fast casual and counter-service models often need less front-of-house investment than full-service bars or fine dining. Delivery-heavy brands may prioritize kitchen throughput over dining room design. Franchise openings add franchise fees and mandated build-out standards that can increase cost but reduce design risk.

    ## Ways operators reduce opening cost

    Leasing second-generation restaurant space is the most common way to lower upfront capital. Turnkey leases with equipment included can compress the timeline from signing to revenue. Buying an existing operating restaurant transfers permits, vendor relationships, and sometimes staff, though business-sale due diligence becomes critical.

    ## What to model before you sign a lease

    Run a simple sources-and-uses table: every dollar of opening capital mapped to lease deposit, TI, equipment, permits, pre-opening, and reserves. Then stress-test rent plus NNN against conservative sales scenarios. If occupancy cost exceeds 10% of projected gross sales before labor and food cost, the site may be structurally expensive for your concept.

    Use restaurant-specific listing data when comparing spaces. Generic square-foot rent comparisons hide the difference between a permitted restaurant with a Type I hood and a retail shell that still needs $300,000 of kitchen infrastructure.

    Browse restaurant space for lease and restaurants for sale on PepperLot.

  • 5 Powerful Examples of Profitable Restaurant Property Investments

    5 Powerful Examples of Profitable Restaurant Property Investments


    TL;DR:

    • Successful restaurant investments rely on strong leases, creditworthy tenants, and prime locations.
    • Cost segregation and bonus depreciation significantly boost after-tax returns on restaurant properties.
    • Diversify investment strategies by assessing risk tolerance, location quality, and potential value-add opportunities.

    Selecting the right restaurant property is one of the most consequential decisions a real estate investor can make. Get it right, and you’re looking at predictable passive income, meaningful tax advantages, and long-term appreciation backed by a corporate guarantee. Get it wrong, and you’re stuck with a vacant shell, a struggling franchisee, and a lease that doesn’t protect you. This guide breaks down the exact criteria, real-world transactions, and financial strategies that separate high-performing restaurant investments from costly mistakes, so you can move with confidence in your next deal.

    Table of Contents

    Key Takeaways

    Point Details
    NNN leases for stability Single-tenant absolute NNN leases offer predictable, hands-off income with strong inflation protection.
    Drive-thru demand surge Modern drive-thru restaurant sites have become top-performing investments since 2020.
    Tax strategies amplify returns Cost segregation and bonus depreciation can generate major first-year tax savings for owners.
    Comparison shapes strategy Side-by-side analysis of investment types reveals risk and reward differences suited to your goals.
    Fundamentals beat hype The most successful investors prioritize real estate fundamentals and secure leases over aggressive cap rates.

    What makes a restaurant property investment lucrative?

    With a clear sense of what’s at stake, let’s clarify what makes a restaurant property investment stand out before reviewing successful real-world cases.

    The foundation of most successful restaurant property investments is the lease structure. The primary mechanic here is the single-tenant absolute triple-net (NNN) lease, which shifts all operating expenses, including taxes, insurance, and maintenance, directly to the tenant. This creates genuinely passive income for the landlord, with built-in rent escalations that protect against inflation. These deals are also ideal vehicles for 1031 exchanges, letting investors defer capital gains taxes by rolling proceeds into like-kind properties.

    Beyond lease structure, you need to understand a few core metrics before you evaluate any deal:

    • Cap rate: The ratio of net operating income to purchase price. A strong range for restaurant properties sits between 4% and 7%, depending on brand strength and location.
    • Tenant credit quality: Corporate-guaranteed leases from publicly traded brands carry far less risk than franchisee-backed deals.
    • Remaining lease term: More years left on the lease means more predictable income and a stronger resale position.
    • Rent-to-revenue ratio: This tells you how sustainable the tenant’s rent obligation is relative to their actual sales volume.
    • Site fundamentals: Traffic counts, demographics, proximity to anchors, and visibility all drive long-term occupancy.

    Tax strategy is another layer that separates sophisticated investors from casual ones. Cost segregation accelerates depreciation on 5 and 15-year property components, generating immediate tax savings that can reach six figures on a single acquisition. Bonus depreciation amplifies those front-loaded benefits even further, boosting your internal rate of return (IRR) in ways that simple cap rate math doesn’t capture.

    “The best restaurant investments aren’t just about yield. They’re about the intersection of a durable lease, a creditworthy tenant, and a location that makes operational sense for the brand.”

    Pro Tip: Always benchmark rent as a percentage of projected revenue. Anything below 10% signals a sustainable obligation for the tenant. Above 12%, you’re looking at a stressed unit that could close before the lease expires.

    Getting these fundamentals right starts with understanding restaurant real estate 101, and then sharpening your eye for evaluating restaurant locations using traffic and demographic data.

    Case study #1: $2.5M Chipotle NNN lease delivers passive cash flow

    Understanding key criteria, let’s see how they play out with a live market transaction involving a blue-chip tenant like Chipotle.

    Marcus & Millichap recently brokered the $2.5M sale of a 5,000 SF Chipotle single-tenant net lease property in Wausau, Wisconsin. The deal featured a 15-year corporate-guaranteed lease, meaning Chipotle’s parent company, not a franchisee, is on the hook for rent payments. That distinction matters enormously.

    Here’s what made this deal attractive to the buyer:

    • Absolute NNN terms: The landlord has zero responsibility for taxes, insurance, or any maintenance costs. The check arrives every month, and that’s the full extent of the landlord’s involvement.
    • Corporate guarantee: Chipotle Mexican Grill, Inc. is a multi-billion-dollar public company. That guarantee is about as creditworthy as you’ll find in the restaurant space.
    • 15-year lease term: Long remaining term means strong resale value and predictable income for over a decade without renegotiation risk.
    • Inflation protection: Rent escalations built into the lease ensure purchasing power doesn’t erode over time.
    • 1031 exchange compatibility: The passive, hands-off nature of the deal makes it ideal for investors rolling out of active real estate into something more manageable.

    Statistic callout: QSR cap rates averaged 5.68% in 2025, holding steady year over year. Top-tier brands like Chick-fil-A and Chipotle trade at mid-4% cap rates, reflecting the premium investors pay for credit quality and brand durability. Weaker or regional brands often price above 6%, compensating buyers for higher tenant risk.

    The Wausau deal is a textbook example of what passive investors target. Low management burden, strong credit, long duration, and a location in a stable Midwestern market. If you’re exploring similar NNN lease deal examples, the structure here is the benchmark to measure against.

    Case study #2: Panera Bread drive-thru, triple-net lessons and opportunities

    Building on the Chipotle case, here’s how the same principles apply to another A-list brand, this time with a drive-thru advantage.

    Hanley Investment Group arranged the $3.3M sale of a 4,373 SF Panera Bread drive-thru property in Plattsburgh, New York. Built in 2020, the property came with an absolute triple-net lease and approximately nine years remaining on the term. The deal illustrates a specific subset of restaurant investment that has surged in demand since 2020: the drive-thru asset.
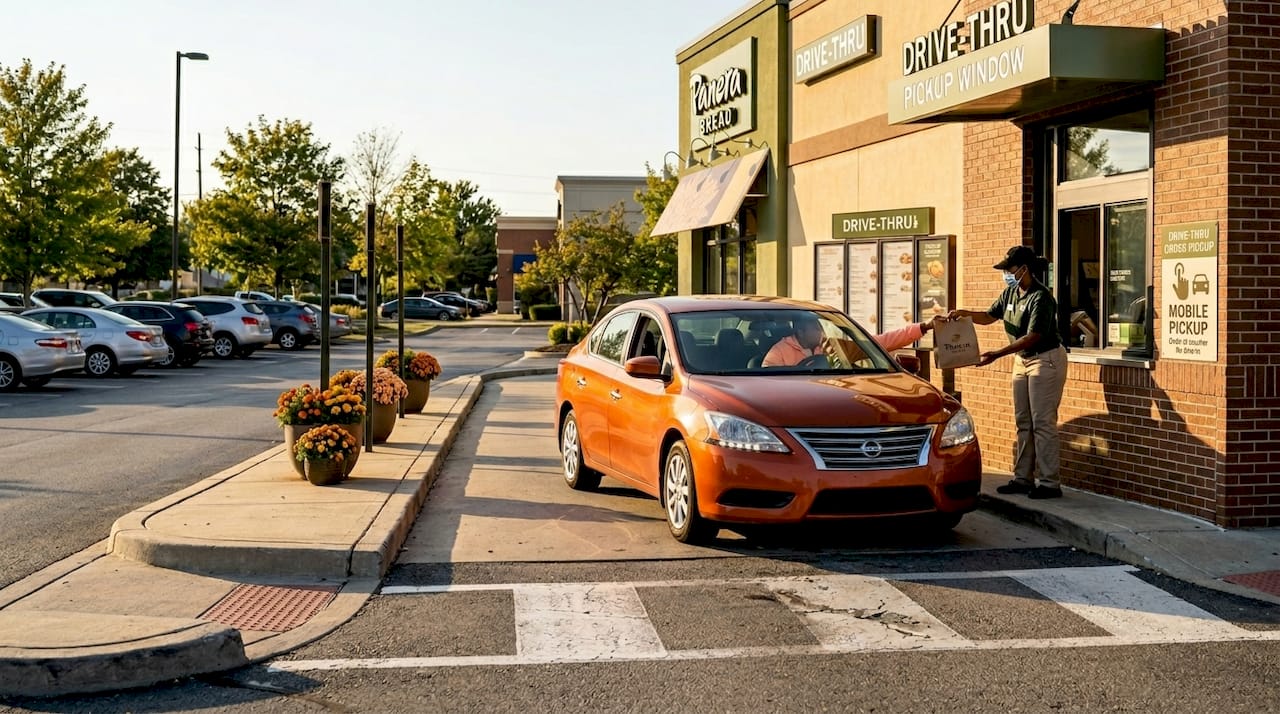
    Panera Bread drive-thru exterior scene

    Why do drive-thru properties command premium pricing? The answer comes down to operational resilience. During periods of disruption, whether from public health events, staffing shortages, or economic downturns, drive-thru units outperform dine-in-only locations by a wide margin. Panera’s investment in digital ordering and loyalty integration makes its drive-thru units even stickier from a revenue standpoint.

    Key takeaways from this transaction:

    • Modern construction reduces capital risk: A 2020 build means minimal deferred maintenance and compliance issues for years to come.
    • Drive-thru premium is real: Investors pay tighter cap rates for drive-thru assets because the format supports higher sales volumes and operational flexibility.
    • Nine years remaining is still investable: While longer is better, nine years provides enough runway for a stable hold period and a clean exit before renegotiation pressure mounts.
    • Location fundamentals matter even here: Plattsburgh sits near the Canadian border with consistent cross-border traffic, adding a geographic demand driver beyond local demographics.
    • Absolute NNN means no surprises: Same as the Chipotle deal, the landlord collects rent and nothing else.

    Pro Tip: When evaluating drive-thru assets, prioritize newer builds on high-traffic corridors with strong visibility from the road. Older properties with deferred maintenance can quietly erode your returns through capital calls you didn’t model. Browse current drive-thru opportunities to see how these fundamentals translate to active listings.

    Tax savings in action: Cost segregation and bonus depreciation

    Besides lease structure, savvy operators also maximize after-tax returns. Here’s how advanced strategies translate directly to the bottom line.

    Most investors focus on cap rates and lease terms. The investors who actually outperform focus on after-tax cash flow. Cost segregation is the most powerful tool in that toolkit, and the numbers from real transactions prove it.

    A fast food restaurant purchased for $1.335M generated $243,000 in first-year tax savings through cost segregation. Over a 10-year period, the net present value of those savings reached $204,000. On a sub-$1.5M acquisition, that’s a transformational boost to IRR that simple yield math completely misses.

    Scale that up: a restaurant property acquired for $9.2M produced $615,000 in first-year tax savings using cost segregation combined with 60% bonus depreciation. That’s over half a million dollars in year-one tax benefit on a single deal.

    Here’s a side-by-side look at how cost segregation outcomes vary by acquisition size:

    Acquisition price First-year tax savings Strategy used 10-year NPV
    $1.335M $243,000 Cost segregation $204,000
    $9.2M $615,000 Cost seg + 60% bonus depreciation Not disclosed

    The mechanics work by reclassifying building components (lighting, flooring, equipment hookups, site improvements) from 39-year depreciation schedules into 5 or 15-year categories. That acceleration front-loads deductions into the early years of ownership, when they have the most present-value impact.

    Key points for operators and investors considering this approach:

    • Works on both new acquisitions and properties you already own (through a “look-back” study)
    • Applicable to single-unit deals and multi-unit portfolios
    • Bonus depreciation rules have shifted over recent years, so timing your acquisition matters
    • A serious cost segregation engineer, not just your CPA, should conduct the study

    For a deeper look at how these strategies connect to restaurant real estate tax benefits, it’s worth reviewing the full picture before your next acquisition.

    Restaurant investment types: Side-by-side comparison

    Now that we’ve walked through the numbers, compare the leading investment structures head-to-head to see which fits your profile best.

    Not every restaurant property investment looks like a Chipotle NNN deal. The market offers several structures, each with distinct risk profiles, yield expectations, and management demands.

    Investment type Typical cap rate Risk level Landlord involvement Key advantage
    Corporate NNN (single-tenant) 4% to 5.5% Low Minimal Credit guarantee, passive income
    Franchisee NNN 5.5% to 7%+ Medium Minimal Higher yield, more risk
    Drive-thru NNN 4.5% to 6% Low to medium Minimal Format resilience, demand premium
    Ground lease 3.5% to 5% Very low None No building ownership risk
    Sale-leaseback Varies Medium Minimal Unlocks operator equity

    Sale-leasebacks and ground leases each carry specific trade-offs worth understanding. Sale-leasebacks let operators unlock equity from owned real estate, but they raise occupancy costs permanently. Ground leases offer the lowest risk since you own the land but not the building, though cap rates compress accordingly. Franchisee-backed deals offer higher yields but carry meaningfully more credit risk than corporate guarantees.

    Here’s a practical framework for choosing the right structure:

    1. Define your income goal. Are you optimizing for yield, stability, or tax efficiency? Each structure serves a different priority.
    2. Assess your risk tolerance. Corporate NNN deals sacrifice yield for certainty. Franchisee deals flip that equation.
    3. Check the remaining lease term. Anything under five years requires a deep discount or a clear re-leasing strategy.
    4. Stress-test the location. Use location analysis tools to confirm the site makes operational sense for the brand, not just financial sense on paper.
    5. Model the tax impact. Run a cost segregation estimate before closing. It changes the effective yield more than most investors expect.

    What most investors miss, and when to break the rules

    As we’ve compared models and strategies, let’s look at some uncomfortable truths and unconventional plays from seasoned investors.

    The restaurant real estate market rewards discipline, but it also punishes blind adherence to formulas. The most instructive lesson of recent years came not from a successful deal but from a catastrophic failure: Red Lobster.

    Private equity’s overleveraging of Red Lobster’s real estate is a case study in what happens when financial engineering overrides operational reality. The strategy involved selling restaurant properties and leasing them back to extract equity, which looked brilliant on a spreadsheet. In practice, it permanently elevated occupancy costs, stripped the operator of location flexibility, and contributed to a bankruptcy that wiped out stakeholders across the capital stack. The lesson isn’t that sale-leasebacks are bad. It’s that structuring real estate decisions around financial optionality without stress-testing the operator’s ability to sustain the resulting rent burden is genuinely dangerous.

    Here’s what that means for your due diligence process:

    Don’t just model the upside. Most pro formas show you what happens if the tenant performs. The question you should be asking is what happens if same-store sales drop 15%. Can the tenant still cover rent? Does the location have enough demand to attract a replacement tenant at a comparable rent? Those answers matter far more than IRR projections built on optimistic assumptions.

    Location beats brand in the long run. A Chipotle in a dying strip mall is a worse investment than a regional chain in a thriving urban corridor. Brand names attract buyers at closing, but location fundamentals determine whether the asset holds value over a 10 to 15-year hold.

    Value-add plays deserve a second look. Conventional wisdom says stick to stabilized NNN assets. But some of the best returns in restaurant real estate come from acquiring distressed or vacant properties, repositioning them with a strong tenant, and capturing the spread between a value-add cap rate and a stabilized one. That requires more work and more risk tolerance, but the math can be compelling. The advanced investment strategies that experienced operators use often involve exactly this kind of repositioning play.

    The investors who consistently outperform aren’t the ones chasing the tightest cap rates on the most famous brands. They’re the ones who understand location, stress-test their assumptions, and know when the conventional playbook doesn’t apply.

    Unlock restaurant property opportunities with Pepperlot

    Armed with case studies and comparison tools, here’s how to put your strategy into action with real, vetted opportunities.

    Pepperlot is built specifically for investors and operators who take restaurant real estate seriously. Unlike generic commercial platforms, every listing on Pepperlot includes the details that actually matter for F&B investments: grease trap specs, seating capacity, existing permits, hood systems, and outdoor patio configurations.
    https://pepperlot.com

    Whether you’re looking for a restaurant space for sale to anchor a passive income strategy, or you want to lease restaurant properties for your next concept, Pepperlot’s curated listings connect you with serious counterparties fast. The platform’s location intelligence tools let you analyze foot traffic, local competition, and demographic demand before you commit, so your next investment decision is grounded in data, not guesswork. With over 500 active users including operators, landlords, and brokers, Pepperlot puts you in the right room.

    Frequently asked questions

    What is a triple-net (NNN) lease in restaurant investing?

    A triple-net lease means the tenant pays all operating expenses, including taxes, insurance, and maintenance, giving the landlord truly passive income with minimal management responsibility.

    How does cost segregation benefit a restaurant property investor?

    Cost segregation accelerates depreciation on building components, letting investors claim large upfront tax deductions that significantly improve first-year cash flow and overall IRR.

    What cap rate should I target for a quick-service restaurant?

    QSR cap rates averaged 5.68% in 2025, with top brands like Chick-fil-A and Chipotle trading in the mid-4% range and weaker operators pricing above 6%.

    Are drive-thru restaurant properties better investments post-2020?

    The $3.3M Panera Bread sale reflects strong investor demand for drive-thru assets, which have proven more operationally resilient and command premium pricing compared to dine-in-only formats.

    What common mistakes should restaurant property investors avoid?

    Overleveraging real estate without stress-testing tenant rent coverage is the most dangerous mistake, as the Red Lobster collapse demonstrated. Always prioritize location quality and lease durability over chasing yield.

    Browse restaurant space for lease and restaurants for sale on PepperLot.
  • Restaurant Real Estate FAQ: Buying, Selling and Leasing Restaurants in California

    Restaurant Real Estate FAQ: Buying, Selling and Leasing Restaurants in California

    **Restaurant Real Estate FAQ**

    Answers to the most common questions from operators, buyers, sellers, and landlords navigating restaurant real estate in California.

    **Buying a Restaurant**

    **How do I buy a restaurant in California?**

    Buying a restaurant in California involves five key stages:
    (1) Define your concept, budget, and target market.
    (2) Search for available opportunities through a restaurant-specific marketplace like PepperLot.
    (3) Conduct due diligence reviewing financials, lease terms, permits, and equipment.
    (4) Submit a Letter of Intent and negotiate deal terms.
    (5) Execute a purchase agreement and close.
    Whether you are pursuing an asset sale (lower risk, clean slate) or a business sale (turnkey operation), the process begins with finding the right opportunity in the right location.

    **What is the difference between an asset sale and a business sale?**
    In an asset sale, you purchase the restaurant’s physical assets (equipment, furniture, inventory) and assume the existing lease. The seller retains all prior liabilities, you start clean. In a business sale, you acquire the entire business entity including its brand, staff, contracts, permits, and all liabilities. Asset sales are lower risk; business sales are appropriate when brand value, customer relationships, or a valuable ABC license justify the additional complexity.

    **How much does it cost to buy a restaurant in California?**
    Restaurant acquisition costs in California vary enormously by transaction type, market, and concept. Asset sale prices for a small to mid-size restaurant in LA or the Bay Area typically range from $30,000 to $300,000 depending on equipment value and lease desirability. Business sale prices reflect a multiple of seller’s discretionary earnings typically 1.5x to 3x annual SDE for independent restaurants. Beyond the purchase price, buyers should budget for working capital (3 to 6 months of operating expenses), any planned renovations, and transaction costs.

    **Do I need a new health permit when I take over an existing restaurant?**
    Yes. The Los Angeles County Department of Public Health’s operating permit is non-transferable. Each new owner must apply for a new permit in their own name. Contact the district office before closing your acquisition, schedule a change of ownership inspection, and submit the permit application at least 30 days before your intended opening. Annual fees range from approximately $772 (small restaurants under 25 seats) to $1,472 (large restaurants over 50 seats).

    **Can I transfer an ABC liquor license when buying a restaurant?**
    An ABC license cannot be transferred directly each new owner must apply for a new license. However, when a restaurant business is sold as a going concern (business sale), the existing license allows the new owner to apply for a transfer of the license with certain priority and continuity benefits. This process takes 3 to 6 months and requires ABC approval, background checks, and public notice. In an asset sale (not a business sale), the buyer must apply for an entirely new license from scratch.
    Leasing a Restaurant

    **What is a second-generation restaurant space?**
    A second-generation (second-gen) restaurant space is a commercial property that was previously operated as a restaurant and retains its food service infrastructure: hood systems, grease traps, commercial plumbing, walk-in coolers, and often existing permits. Second-gen spaces can save operators $100,000 to $500,000 in build-out costs and 6 to 12 months in time to opening compared to converting a raw commercial space.

    **What does NNN mean in a restaurant lease?**
    NNN stands for Triple Net the most common lease structure for California restaurant spaces. Under a NNN lease, you pay base rent plus three additional expense categories: property taxes (1st N), building insurance (2nd N), and common area maintenance or CAM fees (3rd N). NNN charges are estimated at signing and reconciled annually they can escalate significantly. Always negotiate annual caps of 3 to 5% on NNN increases before signing.

    **What percentage of sales should my rent be?**
    The industry standard is that total occupancy cost (base rent plus NNN charges) should not exceed 8 to 10% of gross annual sales. To check affordability before signing, divide your total annual rent obligation by 10% the result is the minimum annual revenue the restaurant must generate to keep rent at a healthy percentage. For a 2,000 sq ft restaurant at $50/sq ft annually ($100,000/year in rent), you need $1,000,000 in annual sales to maintain a 10% rent-to-revenue ratio.

    **What is a Conditional Use Permit and do I need one?**
    A Conditional Use Permit (CUP) is a discretionary approval from the local planning authority allowing certain restaurant uses in zones where they are not permitted by right. CUPs are commonly required in California for alcohol service, late-night operations (after 11 PM), live entertainment, and drive-through service near residential zones. If your concept requires a CUP, factor 3 to 6 months into your timeline and understand that the permit could be conditioned or denied.

    **What should I look for when evaluating a restaurant lease?**
    Key lease provisions to evaluate include: NNN cap (is there a 3 to 5% annual cap on NNN increases?), use clause (is it broad enough to accommodate your concept and future pivots?), personal guarantee (is it limited in amount and duration?), assignment rights (can you assign the lease when you sell the business?), renewal options (how many and at what rent?), and tenant improvement allowance (what is the landlord contributing to your build-out?). Engaging a restaurant-specialized attorney or broker before signing is strongly advisable.

    **Selling a Restaurant**

    **How do I sell my restaurant in California?**
    Selling a restaurant in California involves:
    (1) Preparing your financial statements and lease documents.
    (2) Listing on a restaurant-specific marketplace like PepperLot to reach active buyers and operators.
    (3) Screening and qualifying interested parties before sharing sensitive information.
    (4) Negotiating an LOI and deal structure (asset sale or business sale).
    (5) Allowing the buyer to conduct due diligence.
    (6) Executing a purchase agreement and coordinating the closing, including landlord consent for lease assignment if applicable. A confidential listing protects sensitive information while marketing to a serious audience.

    **How is a restaurant valued for sale?**
    Independent restaurants are typically valued using a multiple of Seller’s Discretionary Earnings (SDE), the business’s net income plus the owner’s salary and benefits, depreciation, and any non-recurring expenses. Multiples for California independent restaurants typically range from 1.5x to 3x annual SDE, depending on concept strength, location, lease terms, and transferable assets. The value of the ABC license, equipment, and remaining lease term are also significant factors. Asset-only sales without a profitable operating history are typically priced based on equipment replacement value and the desirability of the lease.

    **Can I sell my restaurant confidentially?**
    Yes. Many restaurant sales require confidentiality to protect staff relationships, supplier agreements, and customer confidence during the sale process. PepperLot offers confidential listing options that market your opportunity to buyers who are ready to move without publicly disclosing the business name, location, or financial details until a prospective buyer has been screened and has signed a Non-Disclosure Agreement.

    **Location Intelligence**

    **What is cuisine gap analysis and why does it matter?**
    Cuisine gap analysis identifies which food categories are underserved or oversaturated in a specific market area. For example, a neighborhood may have eight Italian restaurants but no Vietnamese concept, creating a market gap that a new operator could fill with lower competition. Understanding cuisine gaps allows operators to choose locations where their concept faces less direct competition and where unmet consumer demand exists a meaningful advantage in site selection that general CRE platforms do not provide.

    **How do I analyze whether a location will support my restaurant?**
    Effective location analysis requires more than walking the neighborhood. Key data points to evaluate include: foot traffic counts and peak periods, demographic profile of the residential population (income, age, household composition), competition density and cuisine mix within your trade area, nearby demand generators (offices, retail, entertainment venues, transit), and any planned construction or development that could affect access. PepperLot’s location intelligence tools provide this analysis in one platform, purpose-built for restaurant site selection.

    Browse restaurant space for lease on PepperLot.

    Browse restaurants for sale and sell a restaurant on PepperLot.

  • Restaurant Real Estate Glossary: Key Terms Explained

    Restaurant Real Estate Glossary: Key Terms Explained

    **Restaurant Real Estate Glossary**

    Restaurant real estate has its own language. Whether you are buying your first restaurant, negotiating a lease for a new concept, or evaluating your first acquisition, knowing these terms will help you move faster, negotiate smarter, and avoid costly mistakes.

    **Lease Terms**

    **NNN Lease (Triple Net Lease)**
    The most common lease structure for restaurant spaces in California. Under a triple net (NNN) lease, the tenant pays base rent plus three additional expense categories: property taxes, building insurance, and common area maintenance (CAM) fees. NNN charges are typically estimated at lease signing and reconciled annually they can escalate significantly over time, particularly after property tax reassessments or major capital expenditures by the landlord. Always negotiate annual caps on NNN increases (typically 3 to 5%) before signing.

    **Base Rent**
    The fixed monthly or annual rent amount, typically quoted in dollars per square foot per year (annual) or per month. Base rent does not include NNN charges or any other operating expense pass-throughs. In California, restaurant base rents are typically quoted on an annual per-square-foot basis.

    **CAM Fees (Common Area Maintenance)**
    The tenant’s proportionate share of costs to maintain shared areas of the property: parking lots, landscaping, exterior lighting, trash removal, security, and property management fees. CAM is the “third N” in a triple net lease and one of the most variable and negotiable components of restaurant occupancy cost.

    **Tenant Improvement Allowance (TIA or TI)**
    A contribution from the landlord toward the tenant’s build-out costs, typically expressed as a dollar amount per square foot. TI allowances for restaurant spaces in California typically range from $20 to $60 per square foot, depending on the market, the landlord’s motivation, and the creditworthiness of the tenant. The landlord typically reimburses serious improvement costs after completion and inspection.

    **Free Rent**
    A period typically one to three months or longer during which the tenant occupies the space without paying rent. Standard for restaurant leases because the build-out period generates no revenue. Always negotiate free rent for the entire build-out period, and ideally an additional soft-opening period.

    **Personal Guarantee**
    A legal commitment by the restaurant owner (as an individual, not just the business entity) to fulfill the lease obligations if the business defaults. Full personal guarantees covering the entire lease term are standard asks from landlords. Experienced operators negotiate “burning” personal guarantees that reduce over time as a performance track record is established.

    **Use Clause**
    The lease provision that defines what type of business the tenant is permitted to operate in the space. Restrictive use clauses (e.g., “Thai restaurant only”) limit flexibility to pivot the concept and reduce the pool of potential buyers if you sell the business. Negotiate for the broadest possible use language: “restaurant, food service, bar, and any related or ancillary uses.”

    **Percentage Rent**
    A rent structure where the tenant pays base rent plus a percentage of gross sales above a specified threshold (the “breakpoint”). Common in shopping centers and high-traffic retail locations. Allows landlords to participate in the upside of a successful restaurant tenant.

    **Co-Tenancy Clause**
    A lease provision that allows a tenant to reduce rent or terminate the lease if a key anchor tenant (such as a major grocery store or department store in a shopping center) vacates. Important for restaurants in shopping center locations where foot traffic depends heavily on an anchor.

    **Lease Assignment**
    The transfer of a tenant’s rights and obligations under an existing commercial lease to a new tenant. The new tenant steps into the existing lease on its current terms. California landlords cannot unreasonably withhold consent to an assignment. A lease assignment right is one of the most important provisions to negotiate it determines whether you can sell your restaurant in the future.

    **Lease Novation**
    A three-party agreement that releases the original tenant from all obligations under the lease while transferring those obligations to a new tenant. Unlike an assignment (where the original tenant may retain contingent liability), a novation fully releases the outgoing party.

    **Option to Renew**
    A lease provision giving the tenant the right but not the obligation to extend the lease for an additional term at a specified rent or a rent determined by a specified formula (often fair market value or CPI-based). Renewal options are critical for long-term restaurant stability and for maintaining business value if you sell.
    Transaction Terms

    **Asset Sale**
    The purchase of a restaurant’s physical assets equipment, furniture, inventory, and the right to assume the existing lease without acquiring the business entity itself. The seller retains all prior liabilities. The most common restaurant acquisition structure for buyers seeking a protected, lower-risk entry.

    **Business Sale**
    The acquisition of a restaurant as a going concern, including the legal entity, brand, operating permits, staff, and all liabilities. Appropriate when the brand, existing customer base, or ABC license carries significant transferable value.

    **Letter of Intent (LOI)**
    A non-binding document that outlines the proposed terms of a restaurant purchase or lease transaction, including price, deal structure, key conditions, and exclusivity period. The LOI is the starting point for formal negotiations and due diligence. PepperLot provides restaurant-specific LOI templates for both purchase and lease transactions.

    **Key Money**
    An upfront payment made by a new tenant to an existing tenant in exchange for the right to take over a desirable lease. Key money represents the tenant’s willingness to pay a premium for a lease with below-market rent, a favorable location, or valuable existing infrastructure. Common in high-demand California restaurant markets.

    **Due Diligence**
    The investigation and verification process conducted by a buyer or tenant before closing a restaurant transaction. Restaurant due diligence includes reviewing financial statements, lease terms, permit status, equipment condition, health inspection history, and any pending litigation or compliance orders.

    **Cap Rate (Capitalization Rate)**
    For restaurant property sales (as opposed to business or lease transactions), the cap rate is the ratio of net operating income to the purchase price. A higher cap rate indicates a higher yield relative to price. Restaurant properties typically trade at cap rates of 5 to 8% in California, depending on location, tenant quality, and lease term.

    **Restaurant Infrastructure Terms**

    **Hood System (Type 1 Hood)**
    A commercial ventilation system installed above cooking equipment to capture grease-laden vapors, smoke, and heat. A Type 1 hood is required for cooking equipment that produces grease or smoke (fryers, ranges, grills, griddles). Hood systems are one of the most expensive and critical pieces of restaurant infrastructure verify capacity, compliance with current fire and health code, and condition in any space you are evaluating.

    **Grease Trap (Grease Interceptor)**
    A plumbing device that captures fats, oils, and grease (FOG) from kitchen wastewater before it enters the municipal sewer system. Required for most restaurant operations in California. Grease traps must be sized to your concept’s cooking volume and require regular professional cleaning and maintenance. An undersized or poorly maintained grease trap is a significant liability and a common cause of health code violations.

    **Second-Generation (Second-Gen) Space**
    A commercial space that was previously operated as a restaurant or food service business and retains its food service infrastructure hood systems, grease traps, commercial plumbing, gas lines, walk-in coolers, and often existing permits. Second-gen spaces dramatically reduce build-out costs and time to opening compared to raw commercial spaces.

    **Walk-in Cooler / Walk-in Freezer**
    Large refrigeration units that operators can physically enter for food storage. Essential for most full-service restaurant operations. In second-generation spaces, verify the age, condition, and compressor capacity of existing walk-ins replacement costs range from $10,000 to $40,000 or more.

    **Three-Compartment Sink**
    A commercial sink with three separate compartments for washing, rinsing, and sanitizing food service equipment and utensils. Required by California health code for all food service operations with dishwashing needs. Verify presence and condition in any restaurant space you are evaluating.

    **Fire Suppression System**
    An automatic fire suppression system installed in the kitchen hood that discharges extinguishing agent if a fire is detected. Required in commercial kitchens in California. Must be inspected and certified semi-annually and is connected to the local fire department. Verify certification status when evaluating any restaurant space.

    **Permit and License Terms**

    **Public Health Permit (LA County)**
    The operating permit issued by the Los Angeles County Department of Public Health Environmental Health Division authorizing a food facility to operate. Non-transferable a new permit must be obtained in each new owner’s name. Required before opening and renewed annually. Annual fees range from approximately $772 (under 25 seats) to $1,472 (51+ seats).

    **ABC License (Alcoholic Beverage Control License)**
    A license issued by the California Department of Alcoholic Beverage Control authorizing a business to sell alcoholic beverages. Restaurant operators most commonly use Type 41 (beer and wine with food) or Type 47 (full service with food) licenses. ABC licenses are not transferable, each new owner must apply for a new license. In high-demand markets, Type 47 licenses can carry significant market value when transferred as part of a business sale.

    **Conditional Use Permit (CUP)**
    A discretionary permit issued by a local planning authority that allows a specific use, such as late-night restaurant operations, alcohol service, or live entertainment, in a zone where that use is not permitted by right. CUPs require a public hearing and can take 3 to 6 months to obtain. Some CUPs transfer with the lease or business; others require reapplication for each new operator.

    **Seller’s Permit (CDTFA)**
    A permit issued by the California Department of Tax and Fee Administration authorizing a business to collect and remit California sales tax. Required for any restaurant selling taxable food and beverage items. Free to obtain and required as part of the health permit application process.

    **Food Handler Card**
    A certification required for all food handlers in California, obtained by completing an accredited food safety training course. Must be obtained within 30 days of hire. Distinct from the Food Safety Manager Certification, which is a more comprehensive qualification required for at least one responsible person at each food facility.

    **Encroachment Permit**
    A permit from the city or county authorizing the use of public right-of-way typically the sidewalk or adjacent public space for outdoor dining. Required for most sidewalk patios and parklets in California. A valuable but often overlooked asset in a restaurant acquisition or lease.

    Browse restaurant space for lease and restaurants for sale on PepperLot.

  • California Restaurant Market Outlook: Openings, Closures, and What the Data Means for Operators

    California Restaurant Market Outlook: Openings, Closures, and What the Data Means for Operators in 2025 and Beyond

    Published by PepperLot | Restaurant Real Estate & Acquisition

    The California restaurant industry is the largest and most complex food service market in the United States. It encompasses everything from neighborhood family-run taquerias and food trucks operating in pop-up markets to the world’s most acclaimed fine dining destinations and billion-dollar quick-service chains. Every year, the market churns through thousands of openings and closures a cycle that reflects broader economic forces, consumer behavior shifts, regulatory changes, and the inherent financial fragility of a business model built on thin margins, high fixed costs, and unpredictable demand.

    For operators, investors, buyers, and brokers active in California’s restaurant real estate market, the data on openings and closures is not just background noise. It is the most revealing indicator of where real estate opportunities lie, which markets are oversaturated, and what conditions a well-capitalized operator needs to navigate in order to build a durable, profitable business. This article takes a comprehensive look at the California restaurant market what the numbers show, why closures are happening, where openings are concentrating, and how smart operators are using the current environment to their advantage.
    The Closure Wave: Understanding the Scale

    The post-pandemic years have been extraordinarily difficult for California’s restaurant industry. The combination of pressures that began in 2020 and have compounded with each passing year represents the most challenging operating environment many California restaurateurs have ever experienced.

    In Los Angeles County alone, the California Employment Development Department has documented more than 150 restaurant closures in 2024, with over 100 additional closures in the first quarter of 2025 alone. The Los Angeles Times tracked more than 100 notable restaurant closures in 2024, up from approximately 65 in 2023 representing a more than 50 percent increase in the pace of closures year over year. At the height of the closure wave, observers estimated that a restaurant was shuttering somewhere in Los Angeles every single day.

    The California Restaurant Association found a 12 percent increase in independent restaurant closures between 2022 and 2024 a period that coincided with back-to-back minimum wage increases, a dramatic spike in food costs, and persistent commercial rent pressure. California also led all states in chain restaurant closures in 2023, with 379 chain locations shuttering across 97 studied chains more than Texas (310) and New York (196) combined, reflecting the state’s position as both the largest restaurant market and the most cost-intensive one.

    The Root Causes: A Multi-Front Cost Crisis

    Minimum Wage Escalation

    California has been on an aggressive minimum wage trajectory for years, with statewide rates rising from $10 in 2016 to $16 in 2023. The enactment of AB 1228 in 2024 created an additional tier for fast food workers, raising minimum wages for fast food chain employees to $20 per hour effective April 1, 2024. This represented a 25 percent increase in the minimum wage floor for this category over a single year a cost increase that most fast food operators could not fully absorb through menu price increases without triggering significant consumer resistance.

    Fast food restaurant closures accelerated sharply in the months following the April 2024 wage increase. Approximately 1,040 new permanently closed labels appeared on California fast food establishments on Google Maps in the period following the increase, compared to 315 in the prior period a more than tripling of closures. While some of this data reflected pre-existing distress rather than the wage increase as a sole trigger, the timing correlation was stark and widely noted by industry observers and operators.
    Food Cost Inflation

    The restaurant industry’s second major cost pressure has been sustained food cost inflation. The USDA reported that the cost of meals at restaurants rose 2.9 percent faster than the cost of food consumed at home in 2024 meaning restaurant operators were absorbing input cost increases that were outpacing what consumers were accustomed to paying at home, creating resistance to the menu price increases needed to maintain margins. For operators running commodity-sensitive menus beef-heavy concepts, seafood, dairy-forward cuisines the margin compression from food cost inflation has been severe.
    Insurance and Utilities.

    California’s insurance market has experienced significant disruption in recent years, driven by wildfire risk, flood risk, and reinsurance market tightening. Commercial property insurance costs in fire-prone areas of Los Angeles have risen sharply, with some operators reporting premium increases of 30 to 50 percent or more at renewal. These costs flow directly through to restaurant operators via NNN lease structures, where tenants bear their proportionate share of building insurance costs.

    Utility costs electricity and natural gas have also risen significantly, adding further pressure to restaurant operators already stretched thin on labor and food costs.
    Post-Pandemic Consumer Behavior

    Consumer behavior in California has not fully returned to pre-pandemic norms. The shift toward remote and hybrid work has permanently reduced lunch-time dining traffic in office-dependent markets. Younger consumers particularly Gen Z diners show a greater comfort with delivery-only ghost kitchen concepts and a stronger price sensitivity that limits their willingness to pay full-service restaurant prices for everyday meals. The most resilient restaurant categories have been those that serve a clear value proposition at an accessible price point, or those offering a sufficiently differentiated dining experience to justify premium pricing.

    The Opening Story: Where Growth Is Happening

    Despite the headline-grabbing closure numbers, new restaurants continue to open across California every month. The composition of new openings, however, reflects the lessons the industry has absorbed from the closure wave.

    In 2023 the peak year of the post-pandemic reopening rebound California recorded approximately 22.3 new restaurant openings per 100,000 residents, ranking among the top states nationally. The fastest-growing categories included dessert shops, hot pot concepts, creperies, and internationally influenced cuisines that offered differentiated experiences at moderate price points. Ghost kitchens and delivery-focused concepts continued to grow, driven by consumer demand for convenience and lower capital requirements for operators entering the market without a dining room build-out.

    In 2024 and 2025, opening activity has moderated considerably. Elevated construction costs, tightened lending conditions, and a more cautious investor environment have slowed the pace of new openings. The operators opening restaurants in this environment tend to be better capitalized, more experienced, and more deliberate about location selection often favoring second-generation spaces that reduce build-out costs and compress time to opening.

    The Geographic Divide: Which California Markets Are Performing?

    California’s restaurant market is not monolithic. Performance varies enormously by geography, and understanding where demand is strongest is essential for informed location decisions.

    Suburban markets have outperformed urban cores in recent years. The shift in residential population from expensive urban centers toward more affordable suburban and exurban communities a trend accelerated by the pandemic and sustained by housing costs has created new dining demand in markets that were previously underserved. Inland Empire cities, parts of San Diego County, Sacramento’s suburban ring, and East Bay communities have attracted new restaurant concepts that would previously have prioritized West Hollywood, Santa Monica, or Downtown San Francisco.

    Within the Los Angeles market, neighborhoods with strong residential density and limited existing restaurant supply rather than the most glamorous dining corridors have shown the most consistent performance. High-visibility locations on Hollywood’s Sunset Strip or Beverly Hills’ Rodeo Drive corridor command premium rents that are difficult to justify without outsized revenue performance; more modest locations in Koreatown, Highland Park, Culver City, and North Hollywood have delivered better rent-to-revenue ratios for many independent operators.

    The Buyer’s Market: Opportunity in the Data

    For buyers and investors who approach the current California restaurant market with clear eyes, the data on closures and shifting market dynamics contains a powerful opportunity signal. When restaurants close at elevated rates, they leave behind second-generation spaces, available equipment, motivated landlords, and in many cases, distressed businesses whose assets can be acquired at a fraction of their replacement cost.
    The post-COVID years have consistently represented a buyer’s market for restaurant acquisitions in California, and this dynamic is expected to persist through 2025 and into 2026. Landlords in markets with elevated vacancy are offering tenant improvement allowances, free rent periods, and below-market rents to attract operators who are ready to move. Equipment from commercial ranges and refrigeration to hood systems and dishwashers is available at distressed pricing through restaurant liquidation channels.

    The operators who successfully leverage this environment share several characteristics: they enter well-capitalized, understanding that adequate working capital is as important as the acquisition price; they choose locations based on data rather than intuition, using market analysis tools to validate foot traffic, demographics, and competition density; they negotiate aggressively on lease terms, securing NNN caps, broad use clauses, and assignability provisions; and they focus on concepts with clear, differentiated value propositions rather than chasing the most crowded categories.
    What Smart Operators Are Doing Differently

    The operators who are succeeding in California’s current restaurant market are not simply those with the best food though that is obviously necessary. They are those who have internalized a fundamentally different relationship with data and real estate.

    They validate locations before committing, using competitive analysis tools to understand the density and quality of existing competition, the income profile and dining habits of the surrounding residential population, and the foot traffic patterns that will determine their peak revenue windows. They structure leases defensively, negotiating hard on personal guarantee limits, NNN caps, use clause breadth, and assignment rights. They right-size their concepts to match their real estate costs choosing 1,200 square feet and efficient operations over 3,500 square feet and high overheads.

    And increasingly, they are choosing second-generation spaces over ground-up build-outs accepting a prior operator’s equipment and layout in exchange for dramatically lower capital requirements, faster paths to opening, and lease terms negotiated with a highly motivated landlord.

    Access California Restaurant Market Intelligence on PepperLot
    PepperLot provides operators, brokers, and investors with the market intelligence and real estate tools needed to succeed in California’s dynamic restaurant market. Search available restaurants for sale and lease across every major California market, analyze locations with our built-in competition and demographic tools, and connect directly with sellers, landlords, and brokers. Visit pepperlot.com to start making smarter restaurant real estate decisions today.

    Browse restaurant space for lease and restaurants for sale on PepperLot.

  • How to Evaluate a Restaurant Location Using Foot Traffic Data

    How to Evaluate a Restaurant Location Using Foot Traffic Data

    Intro:

    Choosing the right restaurant location can make or break your business. While rent and size matter, what really determines success is how many people pass by your door, and whether they’re your target audience.

    That’s where foot traffic and demographic data come in.
    At PepperLot.com
    , we help restaurant operators and brokers make smarter location decisions by combining real property data with restaurant-specific insights.

    Here’s how to use foot traffic, spending, and neighborhood trends to find the perfect restaurant spot.

    1. Why Foot Traffic Matters

    Foot traffic data shows how many people visit a specific area, and when.
    For restaurants, it helps answer questions like:

    Are there consistent lunch crowds on weekdays?

    Does the area get evening or weekend traffic?

    How much pedestrian vs. drive-by visibility does it get?

    Understanding these patterns helps you match your concept to the area’s natural flow. A brunch café thrives in daytime foot traffic, while a bar or dinner concept needs nighttime volume.

    💡 Pro Tip: Use platforms like Placer.ai, PepperLot’s upcoming Competitive Analysis Calculator, or local BID (Business Improvement District) reports to get foot traffic trends by time and day.

    2. Demographics: Who’s in Your Market

    High foot traffic means little if it’s not your target customer. Look at:

    Median household income (to gauge spending power)

    Age distribution (young professionals vs. families vs. retirees)

    Ethnic and cultural mix (great for concept alignment and menu design)

    You can often access these insights through PepperLot’s location intelligence tools or local census data.

    For example, if you’re opening a healthy fast-casual brand, you’ll want daytime workers and higher-income residents within a short walk or drive radius.

    3. Competition and Concept Synergy

    Proximity to other restaurants isn’t always a bad thing. In fact, restaurant clusters often perform better because they attract consistent diners and foot traffic.

    When analyzing competition:

    Identify direct competitors (same cuisine/type)

    Look for complementary concepts (coffee shops, dessert bars, bars, etc.)

    Map out daypart overlap (breakfast/lunch/dinner focus)

    💡 Pro Tip: The PepperLot Competitive Analysis Calculator will help visualize this, showing foot traffic, nearby restaurant types, and local household spending.

    4. Accessibility and Visibility

    Even the busiest street can fail a restaurant if customers can’t park or see your signage.
    When touring a space, evaluate:

    Parking access and number of stalls nearby

    Walkability and street visibility

    Signage exposure (corner lots often win big here)

    Delivery driver access for takeout or catering

    5. Real-World Example

    A recent PepperLot user was deciding between two restaurant spaces, one on a high-traffic retail street and another with lower foot traffic but better parking and visibility.

    After running both through our foot traffic and demographic tools, they chose the second space, it had higher income households within a 1-mile radius and double the weekend visits, a perfect match for their brunch concept.

    6. Make Smarter Location Decisions with PepperLot

    Restaurant real estate is all about fit, between your concept, your customer, and your location.
    PepperLot helps simplify this process by giving you:

    Verified restaurant-ready listings (with venting, hood, and grease trap info)

    Market data on foot traffic, demographics, and competition

    The ability to list your own restaurant or lease opportunity

    👉 Visit PepperLot.com
    to explore spaces or request early access to our Competitive Analysis Calculator launching soon.

    Browse restaurant space for lease and restaurants for sale on PepperLot.
  • The Real Cost of Leasing a Restaurant in LA

    The Real Cost of Leasing a Restaurant in LA

    The Real Cost of Leasing a Restaurant in LA: What to Expect in 2025
    Opening a restaurant in Los Angeles is an exciting venture, but understanding the true cost of leasing a space is crucial for financial planning and long-term success. In 2025, the dynamics of the LA commercial real estate market have evolved, influenced by factors like market stabilization, tenant protections, and shifting demand patterns. This guide provides an in-depth look at what restaurateurs can expect when leasing a restaurant space in LA this year.
    ________________________________________
    📊 Average Lease Rates in Los Angeles
    The cost of leasing a restaurant space in Los Angeles varies significantly based on location, size, and market demand. Here’s a snapshot of average lease rates per square foot in key areas:
    • Citywide Average: Approximately $53 per square foot annually, translating to about $4.42 per square foot per month.
    • West Los Angeles: Around $51 per square foot annually.
    • East Los Angeles: Approximately $32 per square foot annually.
    • Downtown LA: Retail spaces average $3.08 per square foot per month.
    • Santa Monica: Retail spaces average $58.59 per square foot annually.
    These figures highlight the variability in lease costs across different neighborhoods, influenced by factors such as foot traffic, local demand, and proximity to key attractions.
    ________________________________________
    🧾 Understanding Lease Structures
    Restaurant leases in Los Angeles typically follow one of three structures:
    1. Gross Lease: The landlord covers all operating expenses, including taxes, insurance, and maintenance. This structure provides predictable costs for tenants.
    2. Net Lease: Tenants pay a base rent plus a share of operating expenses. There are variations:
    o Single Net Lease (N Lease): Tenant pays base rent and property taxes.
    o Double Net Lease (NN Lease): Tenant pays base rent, property taxes, and insurance.
    o Triple Net Lease (NNN Lease): Tenant pays base rent plus property taxes, insurance, and maintenance costs.
    Understanding these structures is vital for budgeting and financial planning.
    ________________________________________
    🛠️ Additional Costs to Consider
    Beyond base rent, restaurateurs should anticipate the following expenses:
    • Common Area Maintenance (CAM) Fees: Charges for shared spaces and services in multi-tenant properties.
    • Utilities: Costs for electricity, water, gas, and trash services.
    • Property Taxes and Insurance: Depending on the lease structure, these may be the tenant’s responsibility.
    • Renovation and Build-Out Costs: Expenses for customizing the space to meet operational needs.
    • Permits and Licenses: Costs associated with obtaining necessary legal approvals to operate.
    These additional costs can significantly impact the overall budget and should be factored into the financial planning process.
    ________________________________________
    🏙️ Neighborhood-Specific Insights
    Different neighborhoods in Los Angeles offer unique opportunities and challenges for restaurateurs:
    • Downtown LA: Offers a mix of historical charm and modern amenities, attracting a diverse clientele.
    • West Los Angeles: Known for its affluent demographic and high foot traffic, leading to higher lease rates.
    • East Los Angeles: Provides more affordable leasing options with a rich cultural heritage, appealing to a vibrant community.
    • Santa Monica: A prime location with high tourist traffic, but correspondingly high lease costs.
    Each neighborhood presents distinct advantages and considerations, making it essential to align the restaurant concept with the chosen location.
    ________________________________________
    ⚖️ Legal Considerations in 2025
    Starting January 1, 2025, California’s Senate Bill 1103 introduces new protections for “qualifying commercial tenants,” including:
    • Limitations on Rent Increases: Caps on how much and how often rent can be increased during the lease term.
    • Extended Notice Periods: Requirements for longer notice before lease terminations or rent hikes.
    • Enhanced Negotiation Rights: Strengthened ability for tenants to negotiate lease terms.
    These protections aim to provide greater stability and predictability for commercial tenants in California.
    ________________________________________
    💡 Tips for Restaurateurs
    To navigate the leasing landscape effectively:
    • Conduct Thorough Market Research: Understand local market conditions and comparable lease rates.
    • Engage a Real Estate Professional: Work with brokers experienced in restaurant leases to identify suitable properties.
    • Negotiate Lease Terms: Aim for favorable terms, including rent escalations, lease duration, and renewal options.
    • Plan for Additional Costs: Budget for CAM fees, utilities, and other operational expenses.
    • Understand Legal Protections: Stay informed about tenant rights and protections under California law.
    ________________________________________
    📌 Final Thoughts
    Leasing a restaurant space in Los Angeles in 2025 requires careful consideration of various factors, including lease structures, additional costs, neighborhood dynamics, and legal protections. By conducting thorough research and planning, restaurateurs can make informed decisions that align with their business goals and financial capabilities.

    Browse restaurant space for lease on PepperLot.

    Browse restaurants for sale on PepperLot.
  • Top Los Angeles Neighborhoods for New Restaurant Concepts

    Top Los Angeles Neighborhoods for New Restaurant Concepts

    Top Los Angeles Neighborhoods for New Restaurant Concepts in 2025
    Los Angeles has long been a playground for culinary innovation, from street tacos to high-end tasting menus. If you’re planning to open a new restaurant in 2025, location is everything. Certain neighborhoods are emerging as hotspots for new concepts, offering the right mix of foot traffic, demographics, and opportunity. Here’s a breakdown of the top neighborhoods to consider.
    ________________________________________
    1. Arts District, Downtown LA
    Once an industrial hub, the Arts District has transformed into a vibrant cultural and culinary destination. With loft-style spaces, growing residential developments, and a younger, trend-conscious population, it’s ideal for modern casual dining, coffee shops, and craft-driven concepts.
    Data Snapshot:
    Metric Value
    Foot Traffic (weekly) 15,000+ visitors
    Competitor Density High (coffee shops & modern casual)
    Why it’s hot:
    • High density of creative professionals
    • Weekend foot traffic from galleries, breweries, and events
    • Flexible spaces suitable for pop-ups and experimental menus
    ________________________________________
    2. Highland Park
    Highland Park attracts locals seeking authentic, neighborhood-driven dining experiences. Its historic charm makes it perfect for ethnic cuisine, brunch spots, and casual cafes.
    Data Snapshot:
    Metric Value
    Foot Traffic (weekly) 10,000+ visitors
    Competitor Density Moderate (Mexican, coffee, casual dining)
    Why it’s hot:
    • Strong community vibe with loyal regulars
    • Opportunities for hybrid concepts (cafe + retail)
    ________________________________________
    3. West Adams
    West Adams is emerging as a trendy yet approachable neighborhood for new restaurants. It’s attracting operators looking for mid-market casual dining and modern comfort food concepts.
    Data Snapshot:
    Metric Value
    Foot Traffic (weekly) 8,000+ visitors
    Competitor Density Low to moderate
    Why it’s hot:
    • Easy access to major thoroughfares and growing residential population
    • Mix of historic buildings and new developments
    • Less saturated than Culver City or Downtown
    ________________________________________
    4. Silver Lake
    Silver Lake remains a creative epicenter, perfect for boutique coffee shops, small plates, and artisanal restaurants. The neighborhood rewards operators with a loyal, trend-savvy clientele.
    Data Snapshot:
    Metric Value
    Foot Traffic (weekly) 12,000+ visitors
    Competitor Density High (specialty coffee, niche cuisine)
    Why it’s hot:
    • Established food culture with high foot traffic
    • Audience willing to spend on innovative concepts
    • Great for experimental or niche menus
    ________________________________________
    5. Culver City
    Culver City is experiencing a renaissance with new residential and commercial projects. It’s particularly appealing for family-friendly dining, casual lunch spots, and experiential restaurants.
    Data Snapshot:
    Metric Value
    Foot Traffic (weekly) 14,000+ visitors
    Competitor Density Moderate (variety of cuisines, mix of established & new)
    Why it’s hot:
    • Growing office population supporting lunch and happy hour concepts
    • Expanding residential areas bringing consistent dinner traffic
    • Mix of established restaurateurs and new concepts
    ________________________________________
    📌 Key Takeaways for Restaurateurs
    • Emerging neighborhoods like Arts District and West Adams offer opportunities for modern, casual, and experimental dining.
    • Trend-conscious areas like Silver Lake favor niche, artisanal, and high-quality concepts.
    • Community-driven neighborhoods like Highland Park and Culver City reward concepts that build loyalty.
    • Foot traffic and competitor density give insight into potential revenue and positioning.
    ________________________________________
    Opening a restaurant in Los Angeles is as much about choosing the right neighborhood as it is about concept and execution. Platforms like PepperLot make it easier to find, lease, or buy spaces in these emerging hotspots, connecting you with landlords, brokers, and other operators who understand the market.
    Start exploring opportunities today at PepperLot.com.

    Browse restaurant space for lease and restaurants for sale on PepperLot.